shiny_praatpicture()2 Shiny app
The most flexible way to use the praatpicture library and the best way to integrate plots in your R documents is with the praatpicture() function. But if you just want to make a quick plot and you’d rather not go through the hassle of learning all the argument names, you can use a graphical user interface (a so-called “Shiny app”) instead. This is still in a somewhat experimental stage and is not as full-featured, but should be sufficient for most purposes. Be aware, though, that the Shiny app currently limits file sizes to 5MB, so this only works with short audio files.
Simply run the following code:
And the following window should appear:
![]()
If you upload a sound file, it will be plotted immediately:
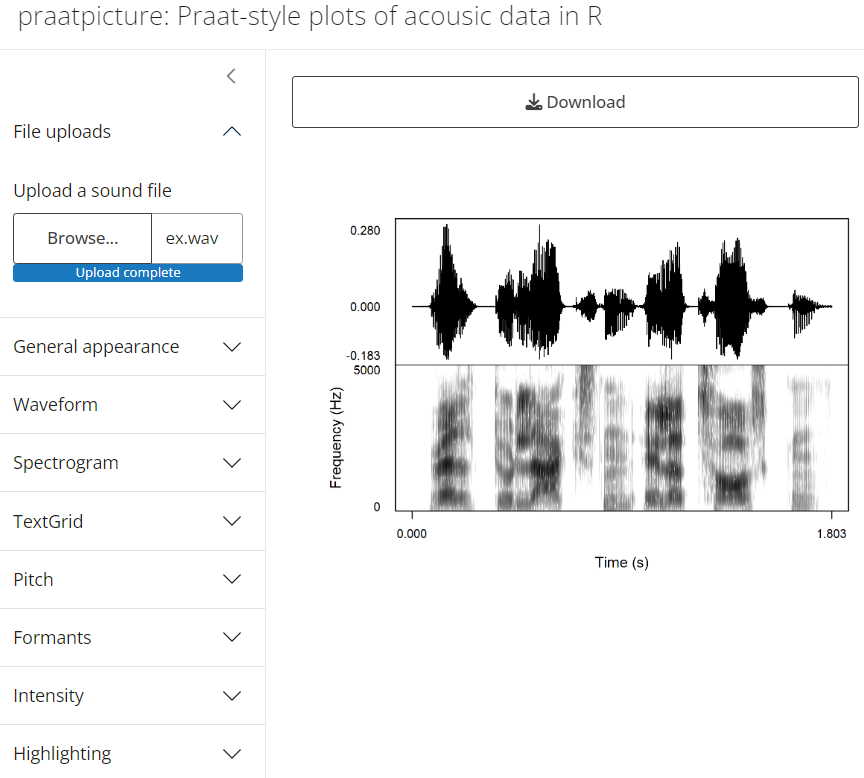
By expanding the menu items on the left, you can access most of the same arguments that you can toggle using the praatpicture() function; they’re all explained in the following chapters.
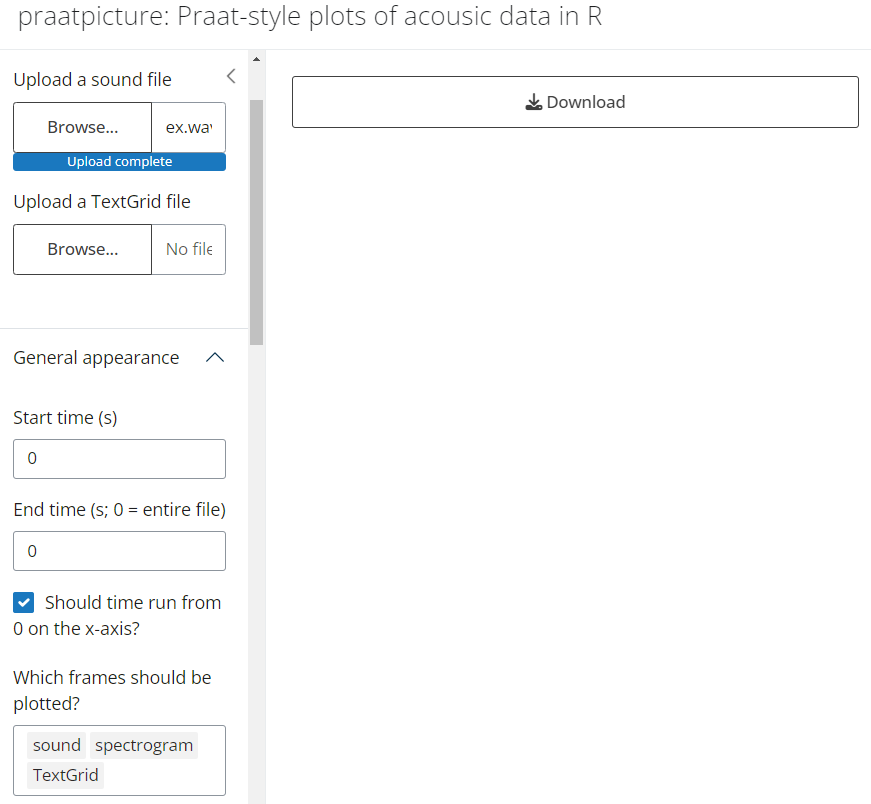
For example, if you expand the menu item “General apperance”, you’ll see the option “Which frames should be plotted?”. If you add TextGrid, you’ll be prompted to upload a .TextGrid file:
Once you’ve uploaded this, the plot will regenerate automatically:
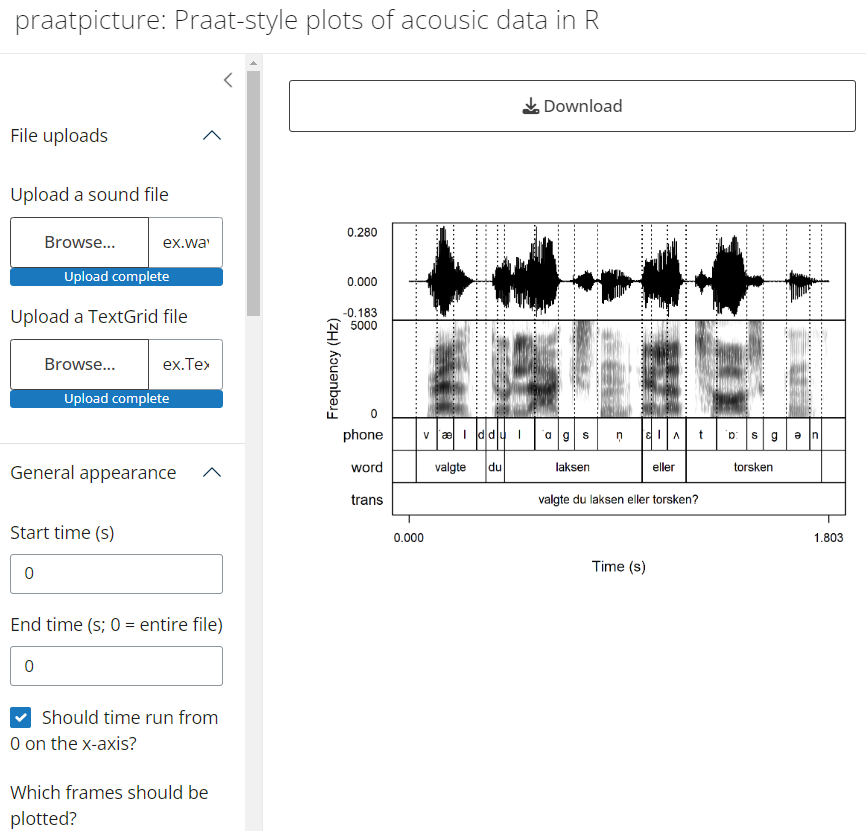
Generally, whenever you change one of the parameters, the plot will regenerate automatically. Once you’re done editing your plot, simply click the “Download” button.