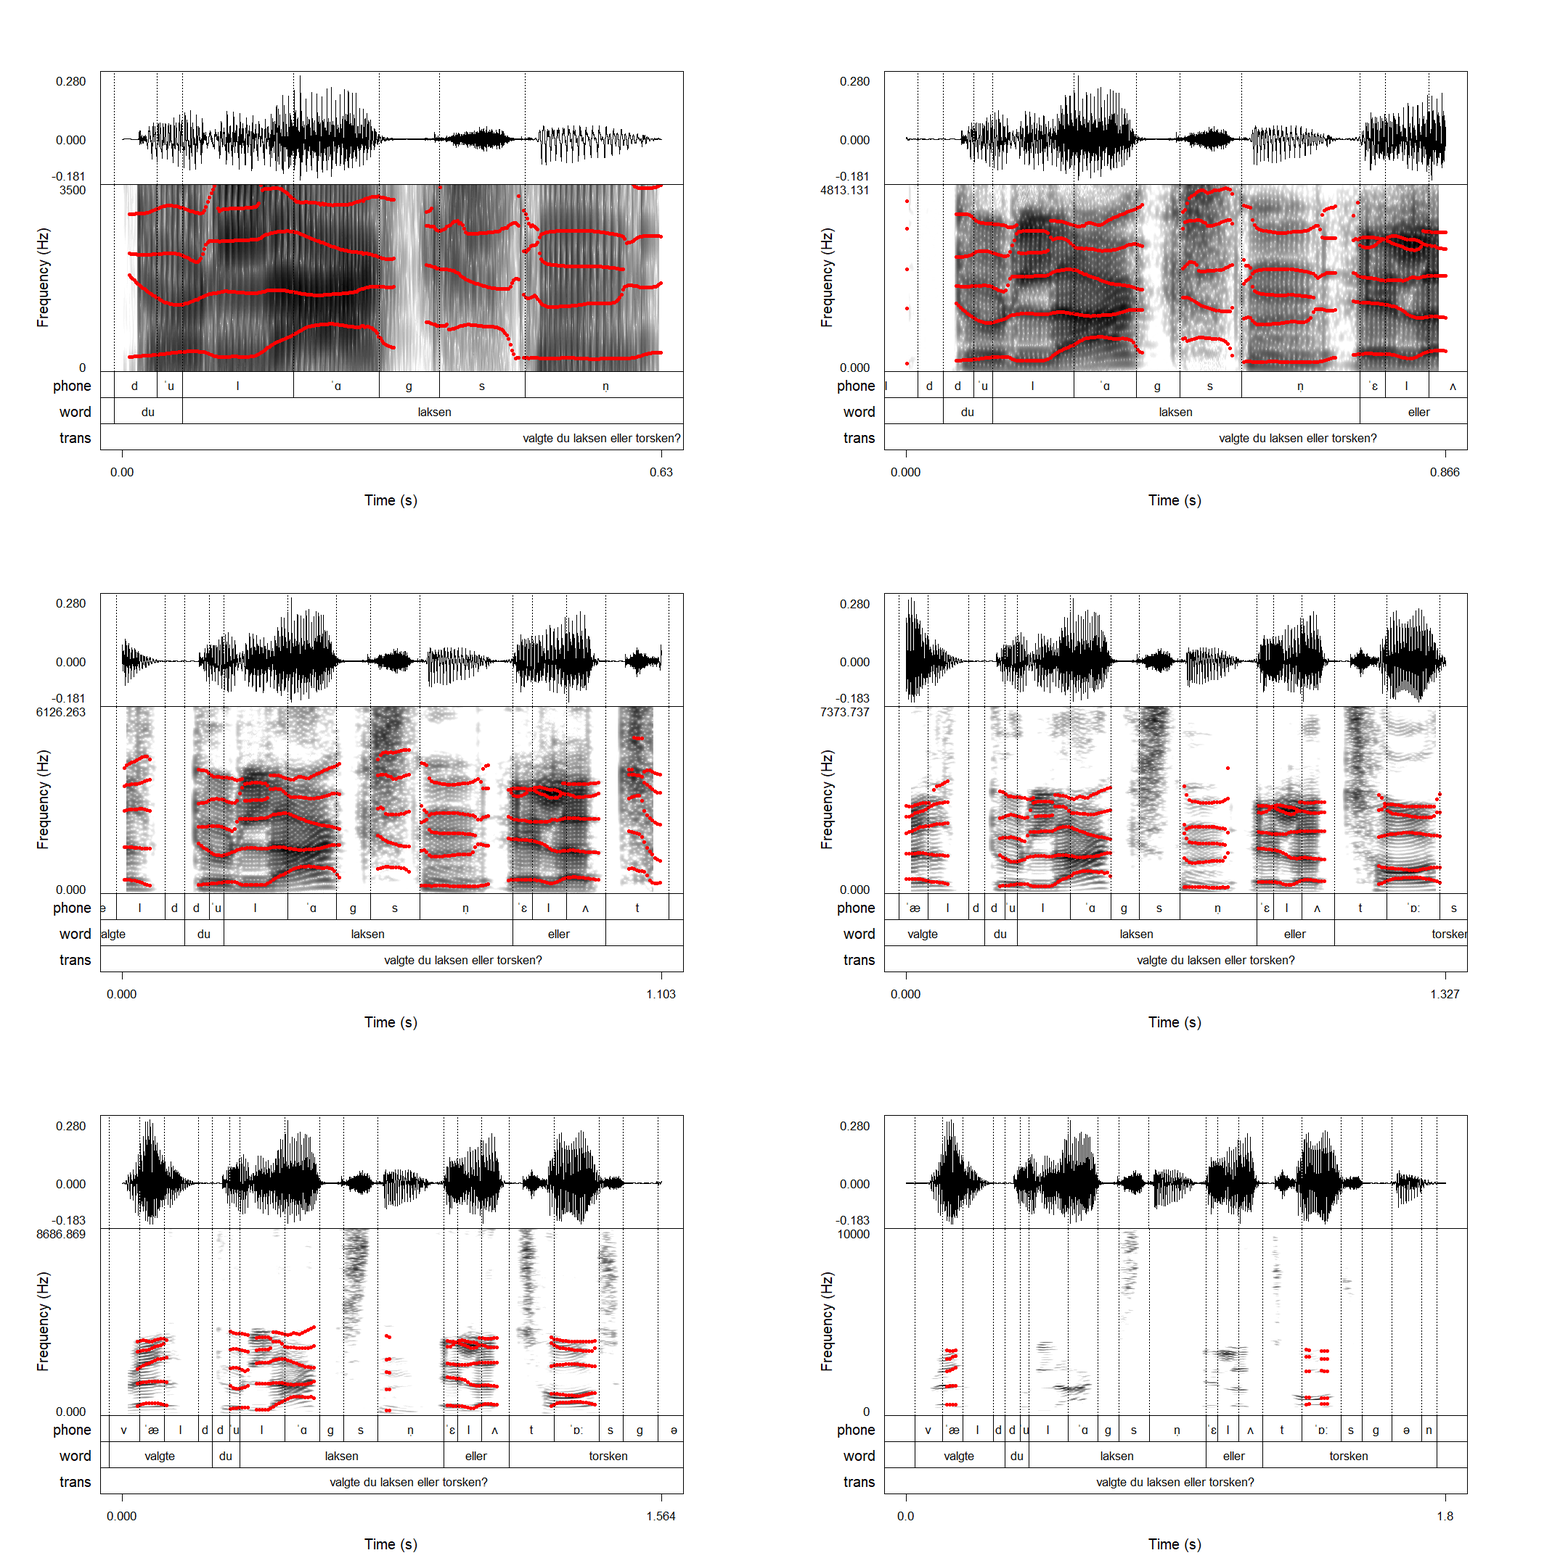
praatanimation('ex/ex.wav',
               start = c(0, 0.34),
end = c(1.8, 0.97))14 Animations
14.1 Basic usage
The function praatanimation() allows you to make animated praatpicture() style plots. It takes most of the same arguments as praatpicture(), but the numeric variables in praatanimation() can typically take twice as many values.
For example, we could pass a vector of two numbers to start and a vector of two numbers to end. The first of the two numbers will then determine where the animation begins, and the second will determine where it ends. We can use this to gradually zoom in to a sound file:
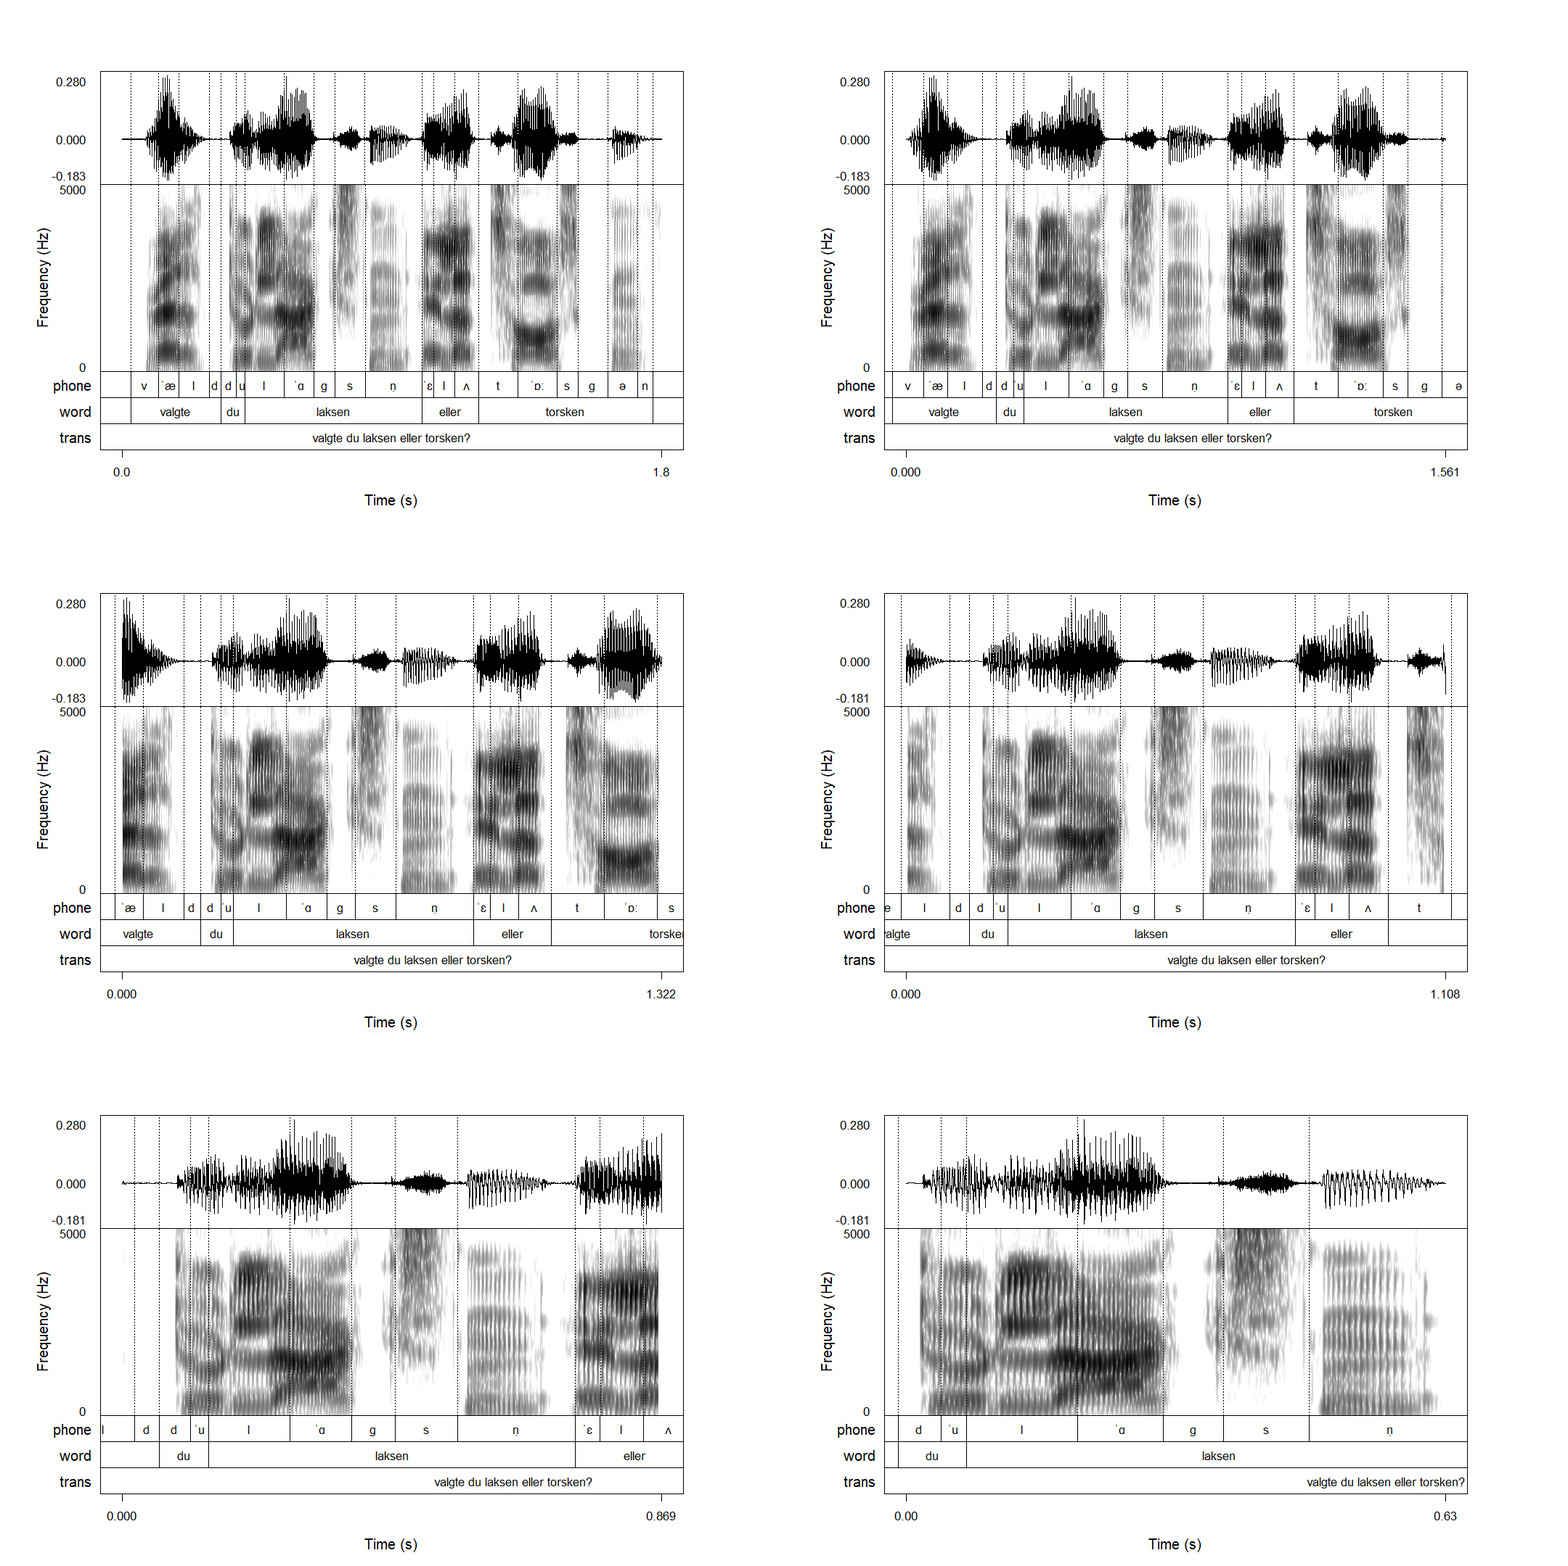
You can control how many images this animation consists of with the n_frames argument, and you can control how quickly the animation changes with the frameRate argument. Here is the same animation with more frames, and more frames per second:
praatanimation('ex/ex.wav',
               start = c(0, 0.34),
               end = c(1.8, 0.97),
               frameRate = 50,
               n_frames = 100)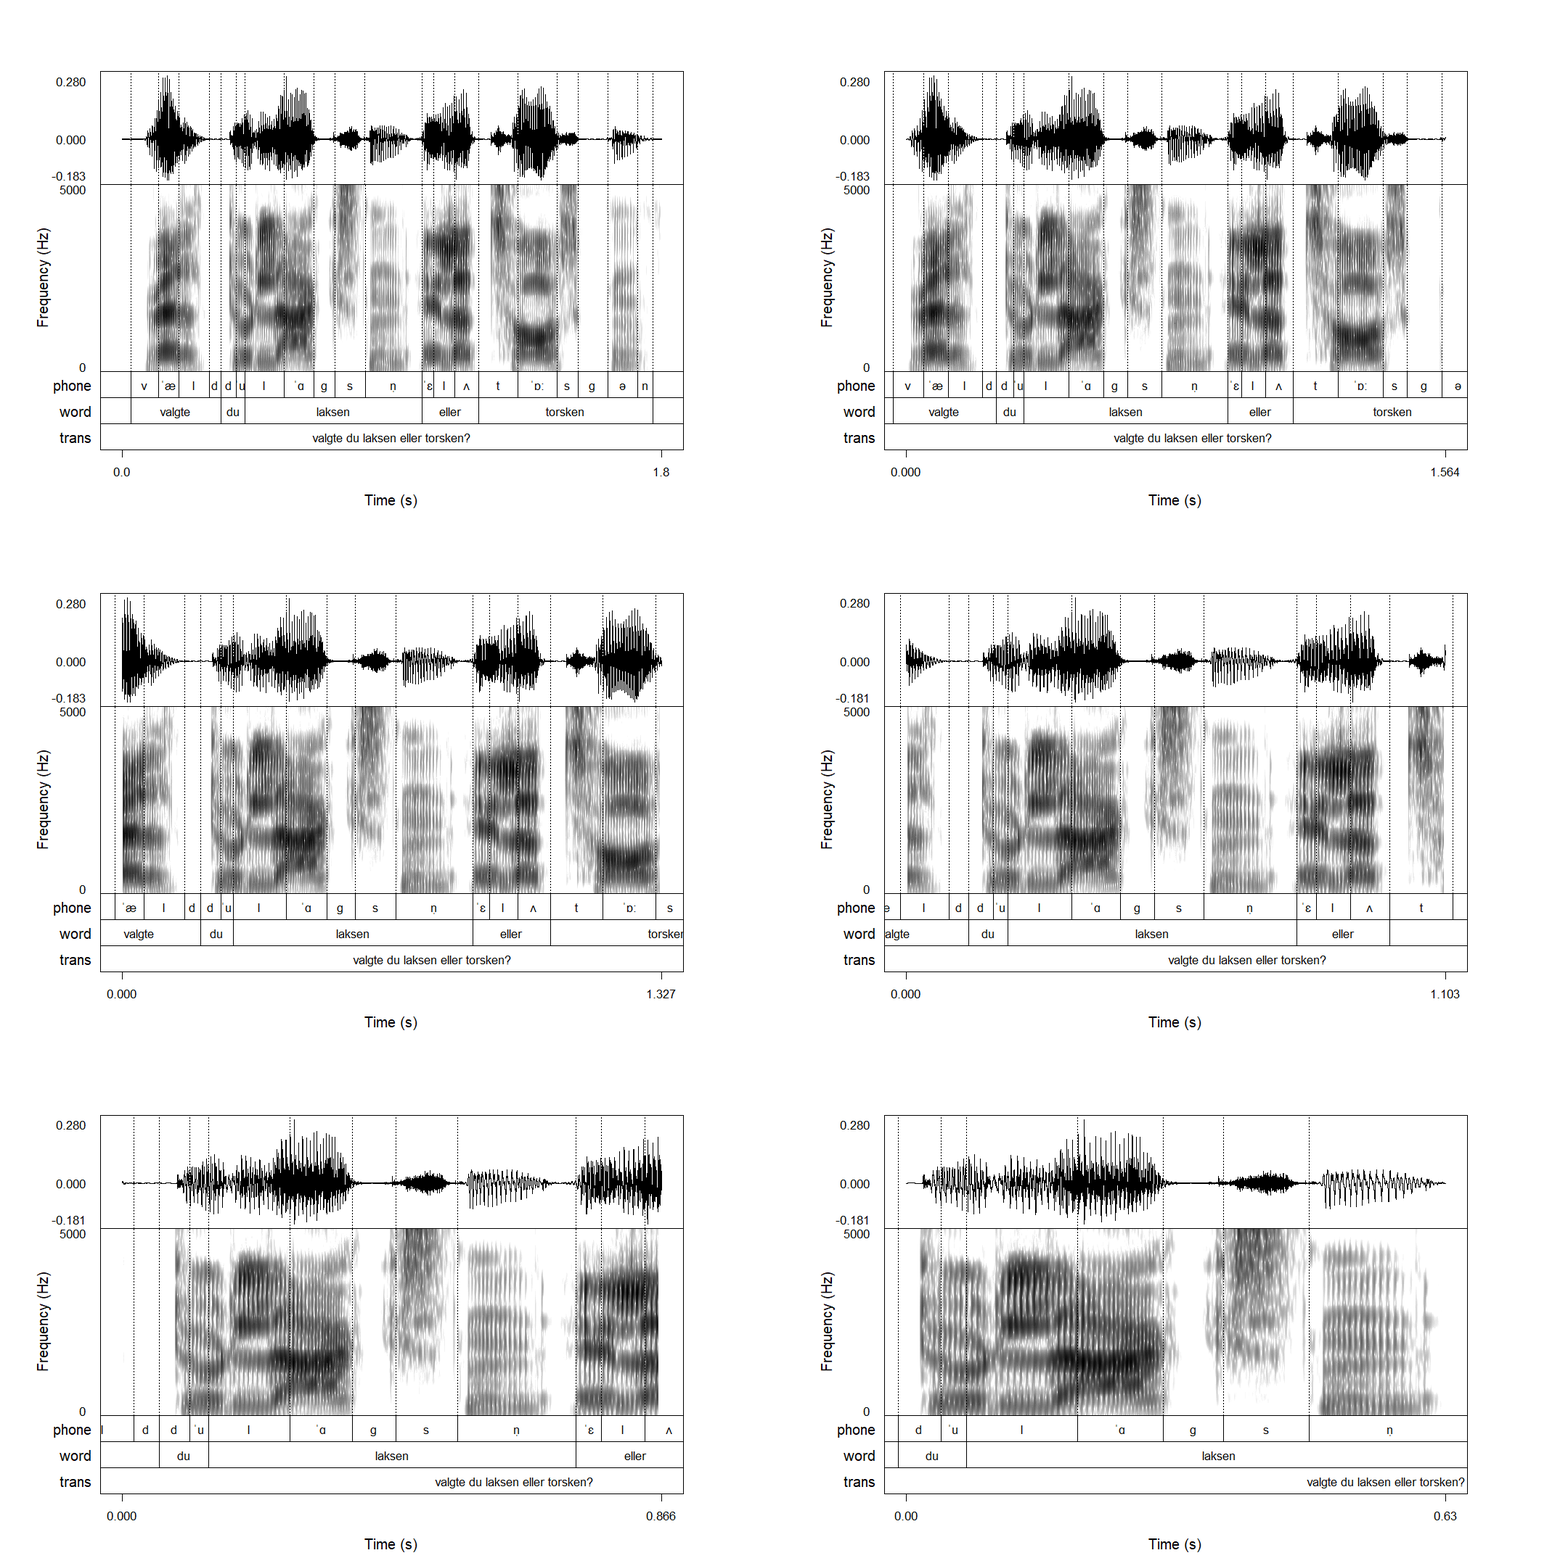
By default, these animations are shown in the Viewer pane for RStudio users. You can save them by setting the useViewer argument to FALSE and by specifying a file name. By default, animations are looping GIFs, but you can disable looping with the loop argument, and you can save animations as mp4 videos with the outputFormat argument.
You can control the dimensions and quality of the resulting image, as well as font size, in the same way as we saw in Section 13.3.
14.2 Some more examples (because it’s fun!)
An especially nice-looking use of praatanimation() is to move through the intensity plots by manipulating the start and end arguments:
praatanimation('ex/ex.wav',
               start = c(0, 1.3),
               end = c(0.5, 1.8),
               n_frames = 150,
               frames = c('sound', 'intensity', 'TextGrid'))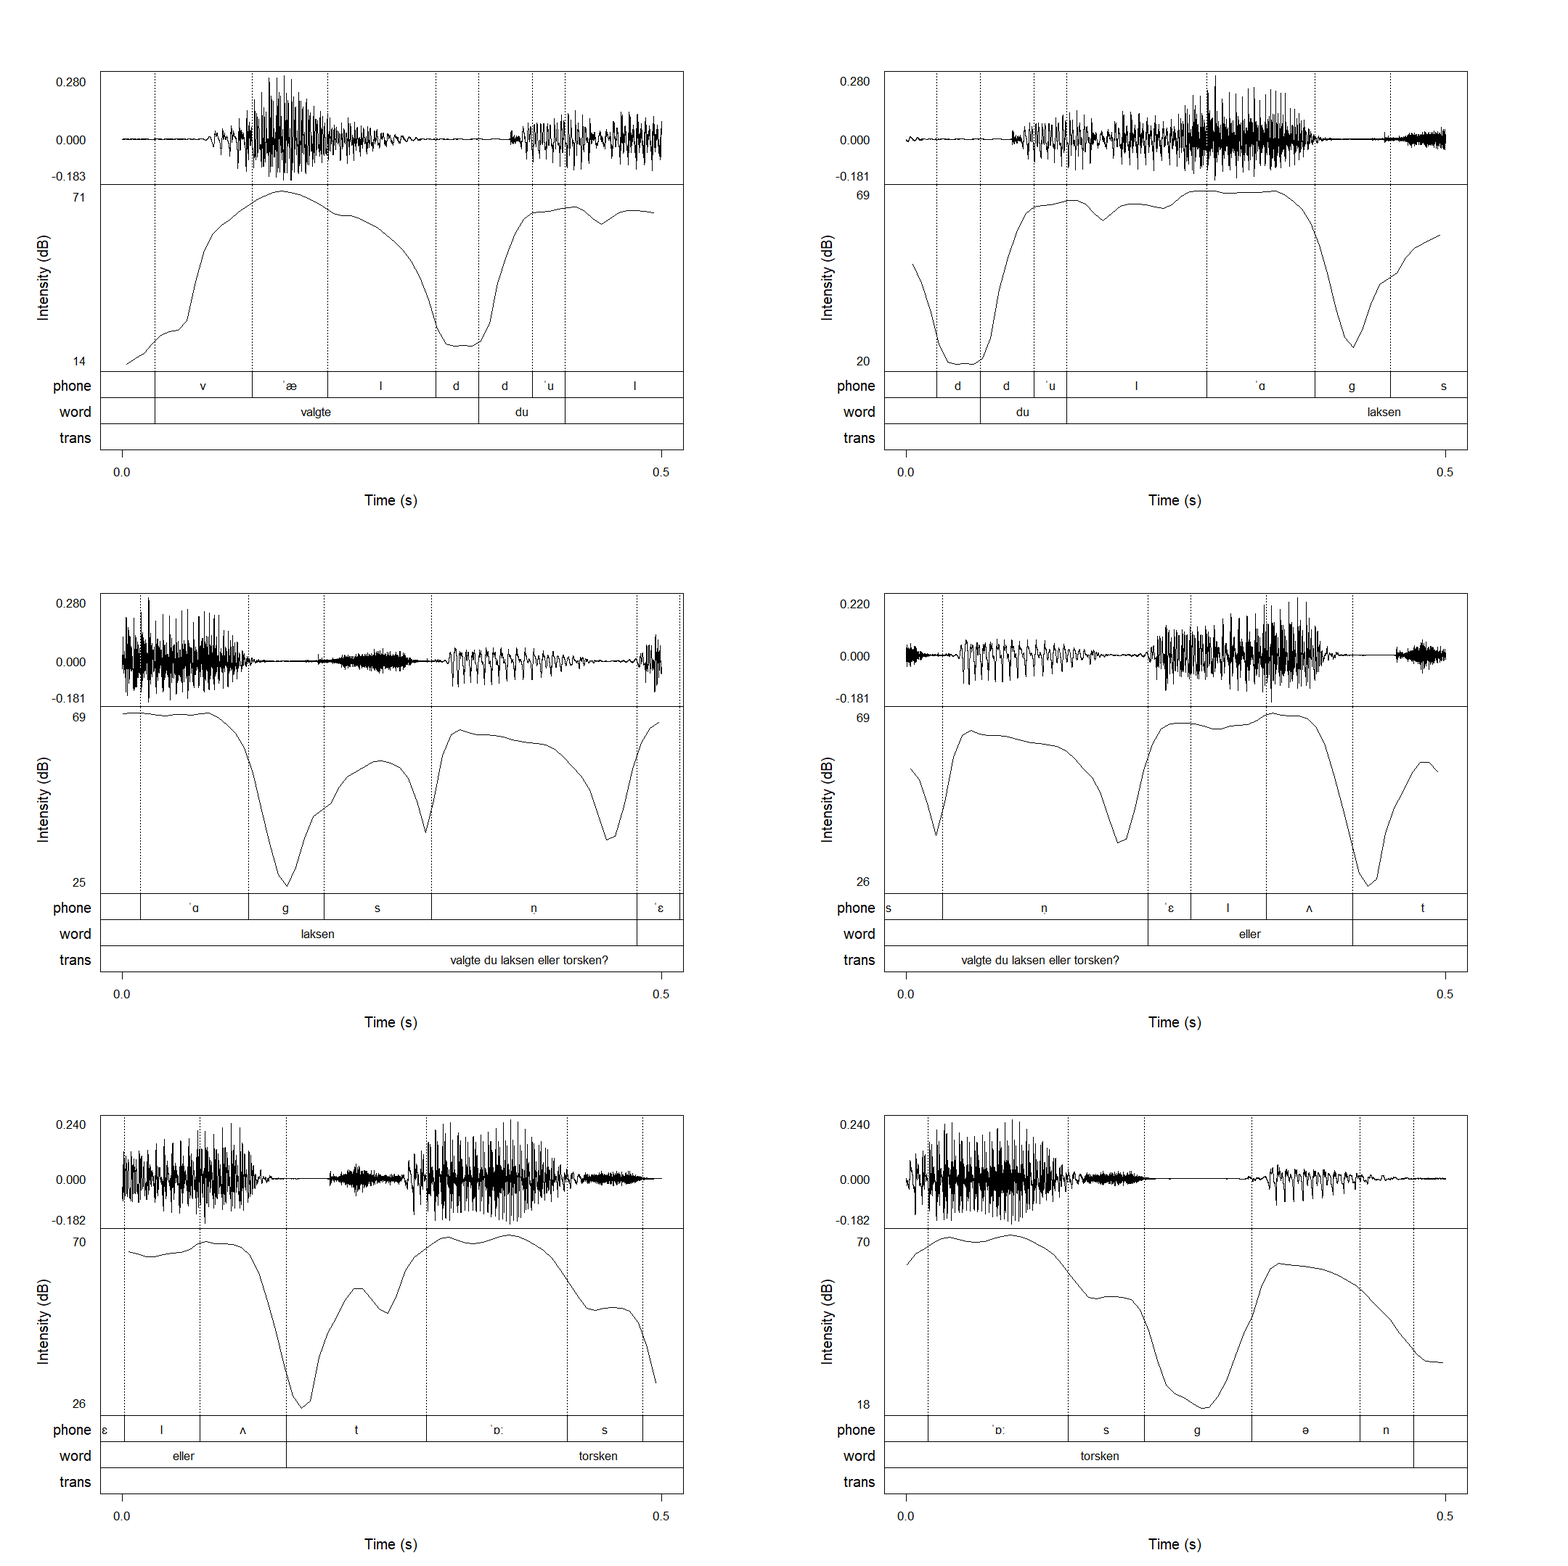
I also find that these animations are very useful for explaining the difference between narrow-band and broad-band spectrograms:
praatanimation('ex/ex.wav',
               spec_windowLength = c(0.003, 0.04))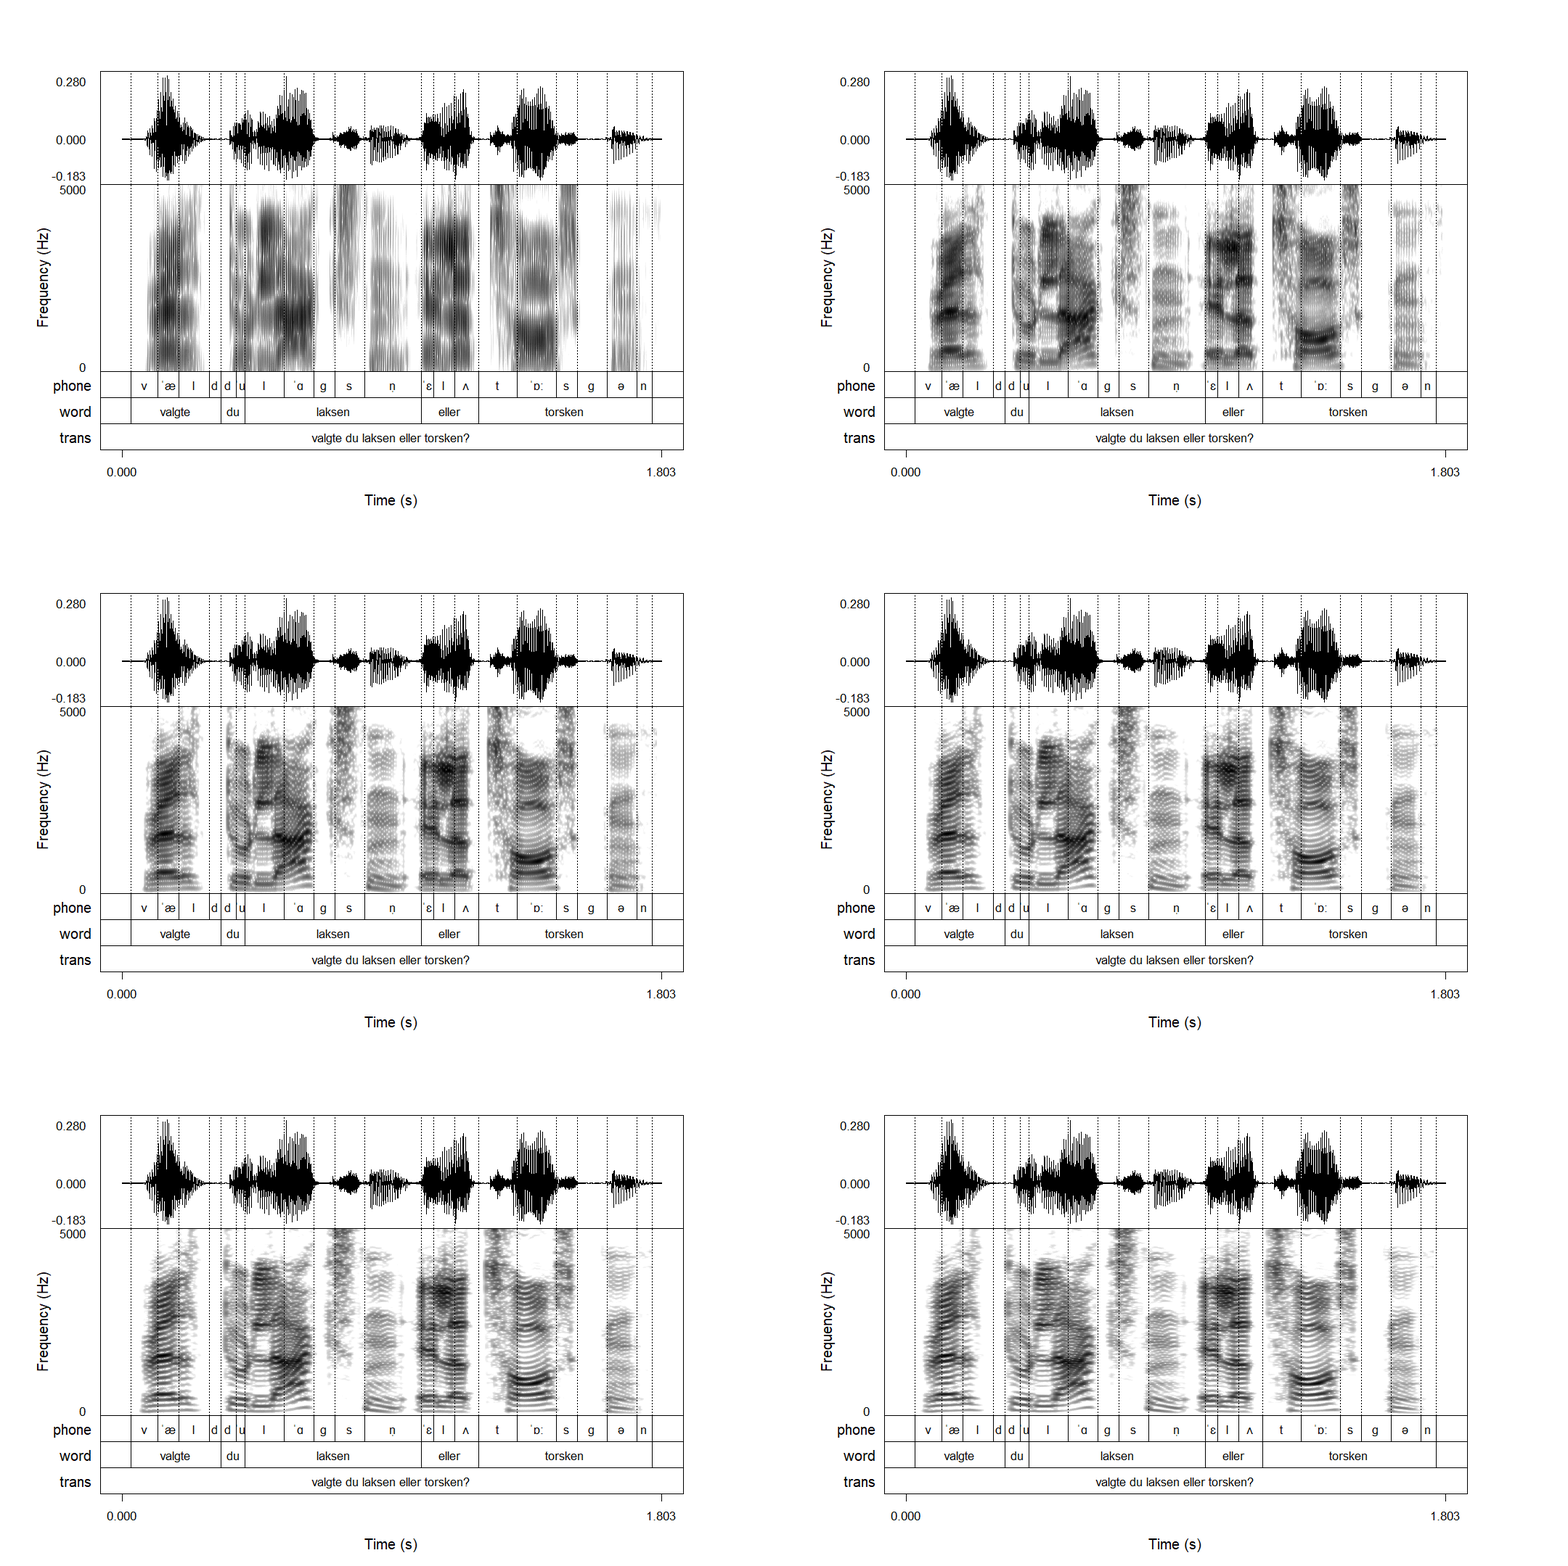
You can animate as many parameters as you want in one plot, so try and have fun with it! I’ll leave the source code for the following animation as an exercise to the reader:
