library(emuR)
db <- load_emuDB('ex/aarhus_emuDB')
INFO: Checking if cache needs update for 1 sessions and 1 bundles ...
INFO: Performing precheck and calculating checksums (== MD5 sums) for _annot.json files ...
INFO: Nothing to update!The EMU Speech Database Management System is an excellent tool for phonetic corpus management, integrated with R through the emuR package. If you’re an EMU user, it may have struck you that there aren’t really many dedicated plotting tools. Especially if you’ve wanted to make plots with aligned annotations, your best option was really to convert your EMU annotations to a Praat-readable format. The praatpicture package comes with a function emupicture() that makes this process much easier.
emupicture() can only be used if you have an EMU database loaded in R. We’ll load a toy database for this purpose:
library(emuR)
db <- load_emuDB('ex/aarhus_emuDB')INFO: Checking if cache needs update for 1 sessions and 1 bundles ...
INFO: Performing precheck and calculating checksums (== MD5 sums) for _annot.json files ...
INFO: Nothing to update!If we have a look at this database, we’ll see that it has just one ‘session’ and one ‘bundle’ (i.e. a single sound file).
serve(db)You should now see this view:
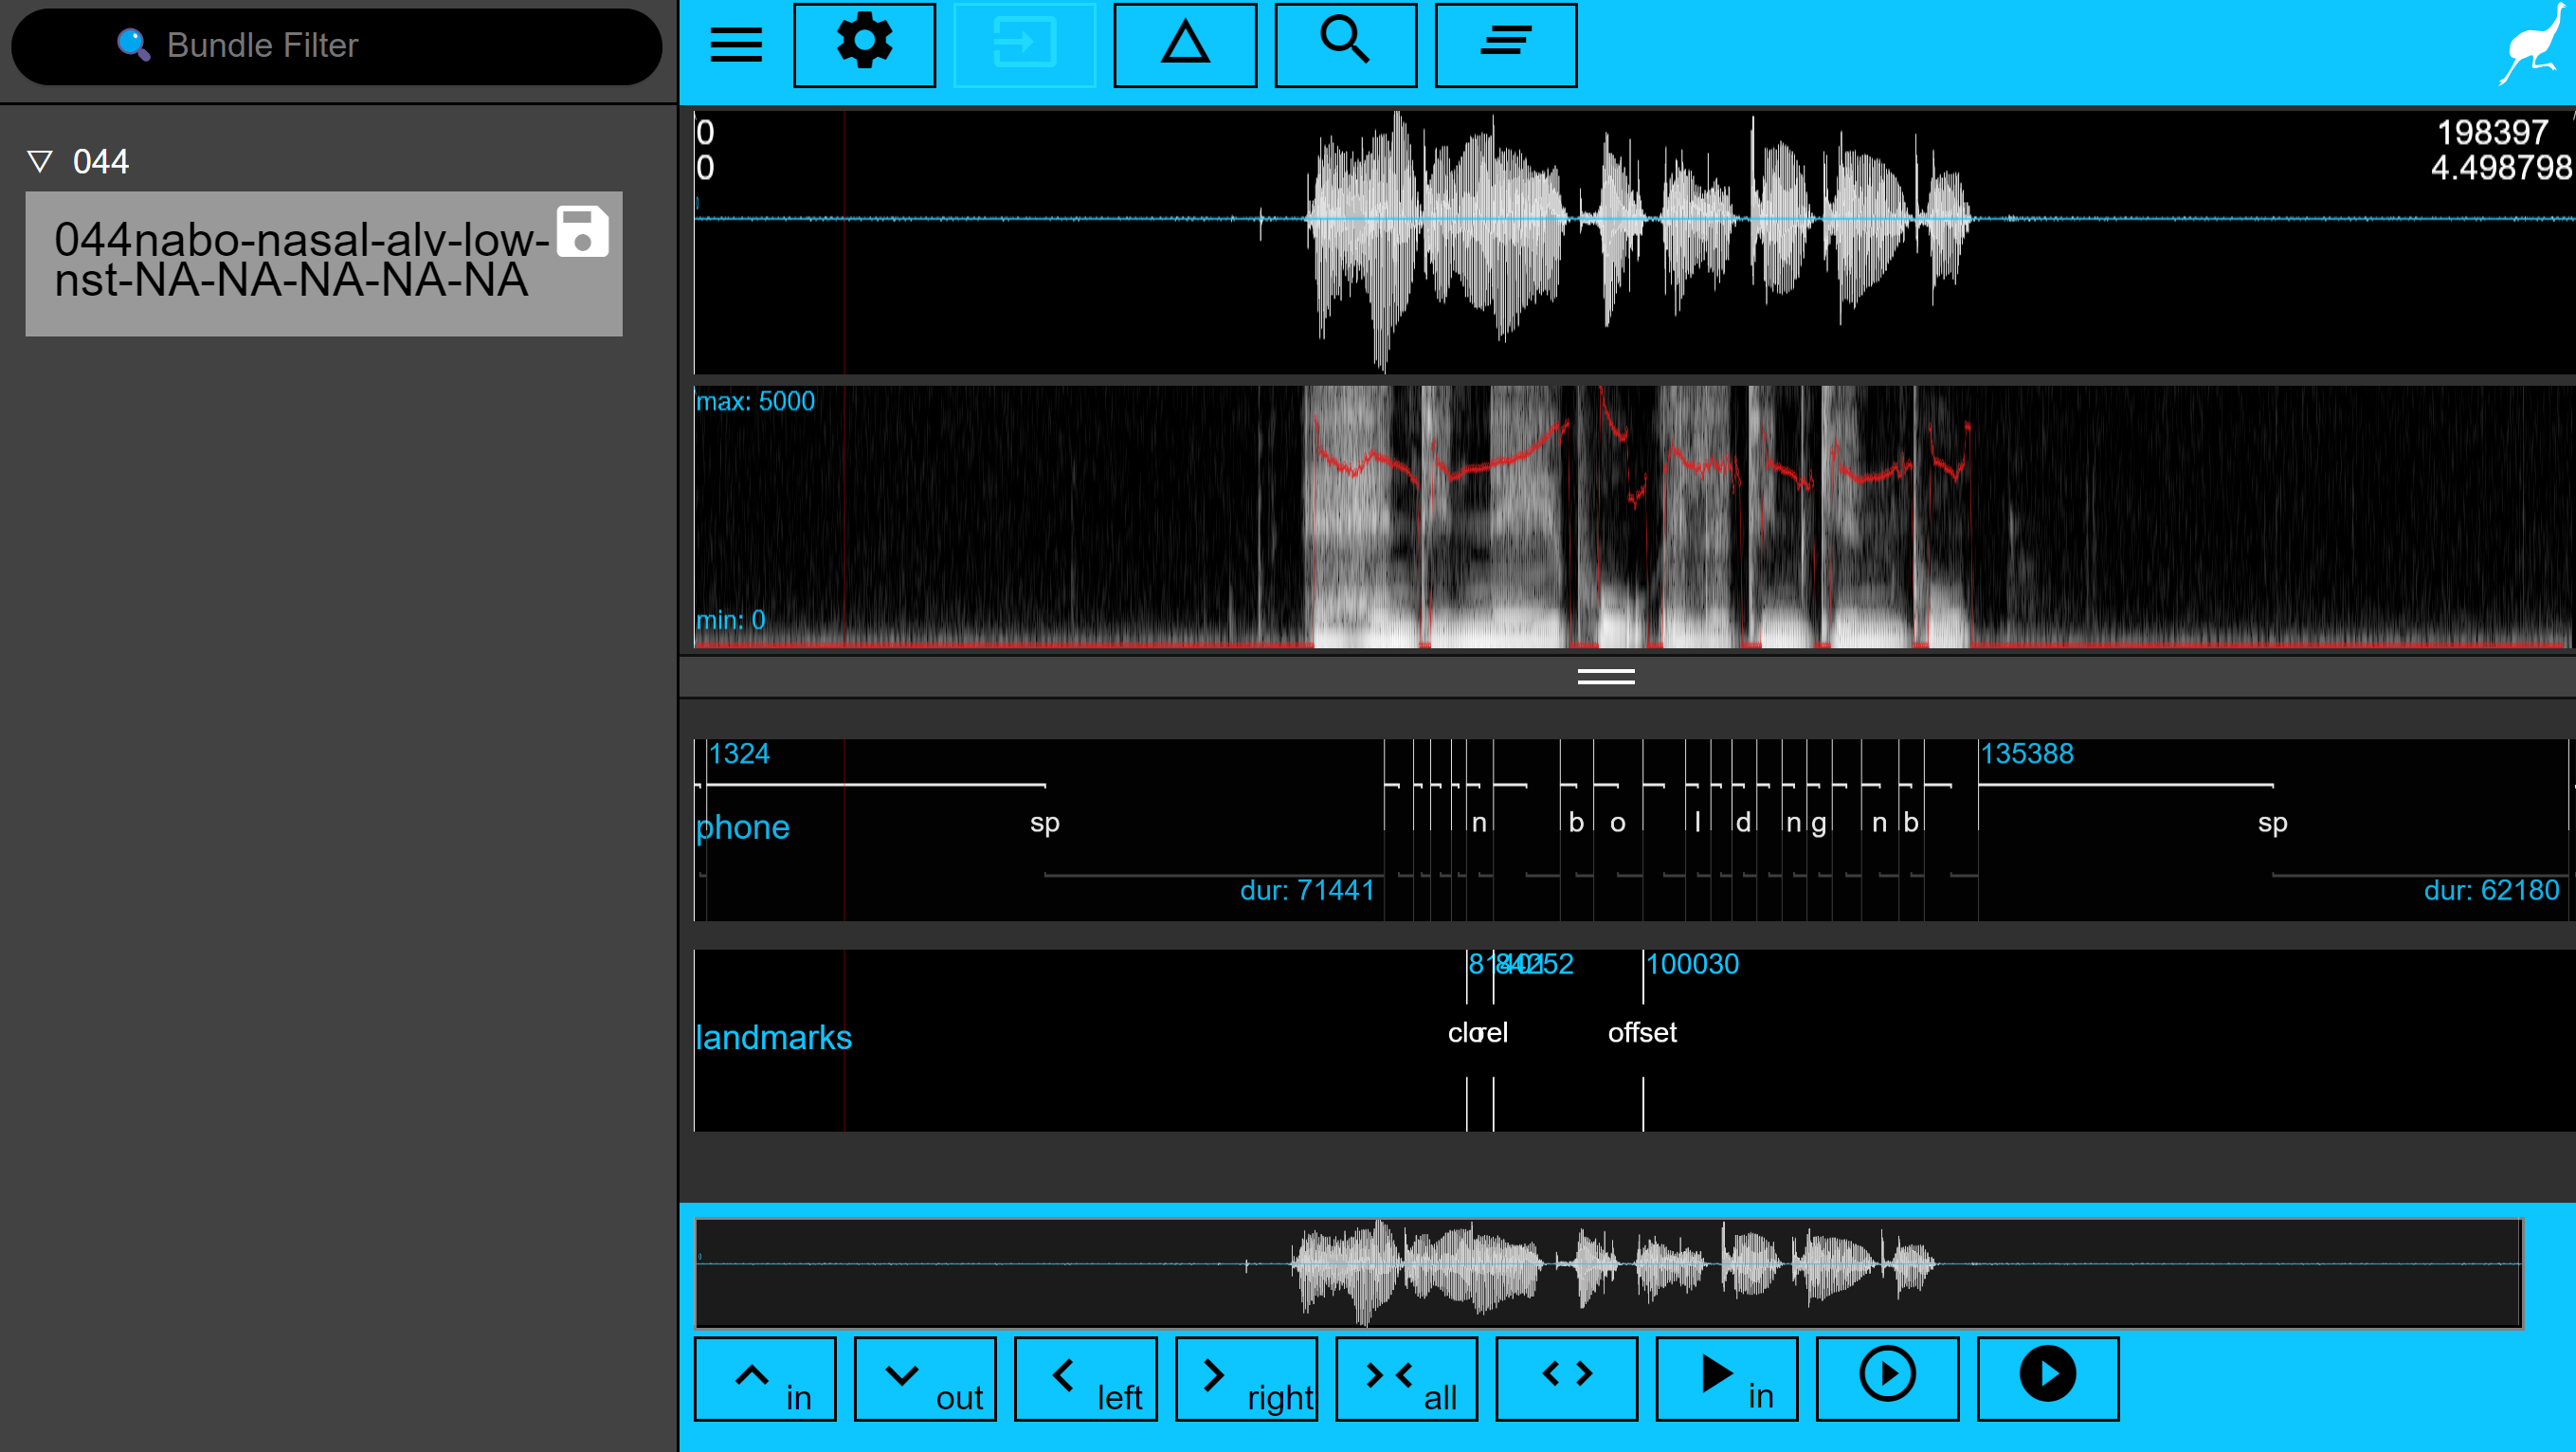
You’ll see just two annotation tiers, but there are also some hidden ones in this database, which we can see with the list_levelDefinitions() function:
list_levelDefinitions(db)Plotting the view you see when you serve() the database in a praatpicture()-like manner is very simple. There are just a few arguments that are different: emupicture() requires the handle of a loaded EMU database db_handle, a bundle name, and optionally a session name. We can see what these are in the image above, and if you’re used to the EMU-SDMS, these concepts should all be familiar.
Here, we’ll load the view we see in the database, zoomed in a bit and plotting just the same two annotation tiers on the picture above. These arguments will all be familiar from previous sections of this manual.
emupicture(db_handle = db,
           session = '_044',
           bundle = '044nabo-nasal-alv-low-nst-NA-NA-NA-NA-NA',
           start = 1.4, end = 3.1,
           tg_tiers = c('phone', 'landmarks'))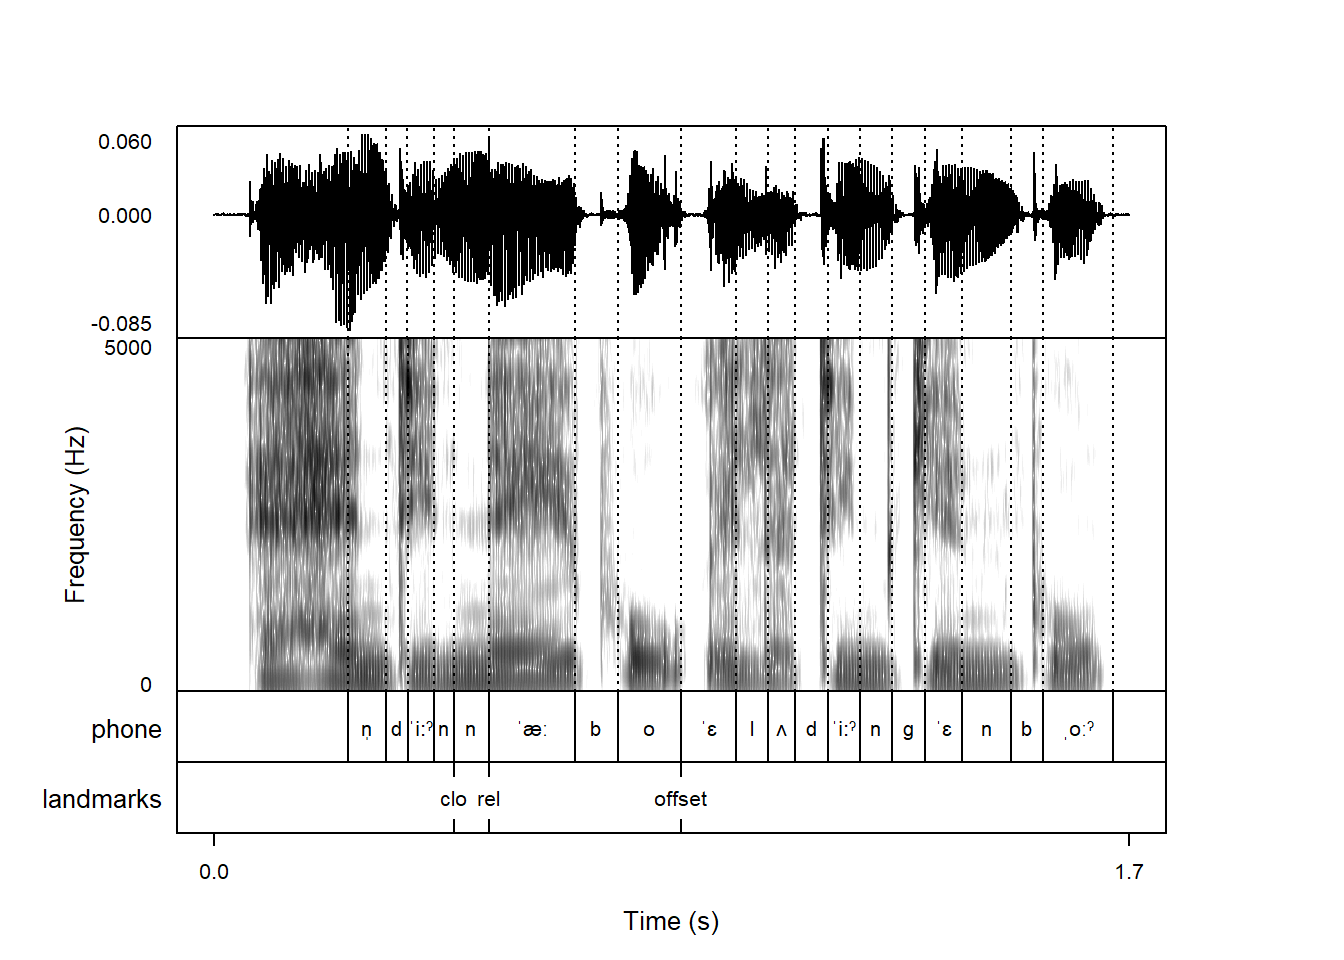
emupicture() will otherwise accept all the same arguments as praatpicture().
We saw in Chapter 13 that it’s possible to use the function talking_praatpicture() to make single-frame videos with embedded audio, which is very useful for presentations. This trick is also possible using emupicture(), by setting the argument talking = TRUE.
emupicture(db_handle = db,
           session = '_044',
           bundle = '044nabo-nasal-alv-low-nst-NA-NA-NA-NA-NA',
           start = 1.4, end = 3.1,
           tg_tiers = c('phone', 'landmarks'),
talking = TRUE)When using emupicture() with talking = TRUE, all the arguments from talking_praatpicture() can be used.
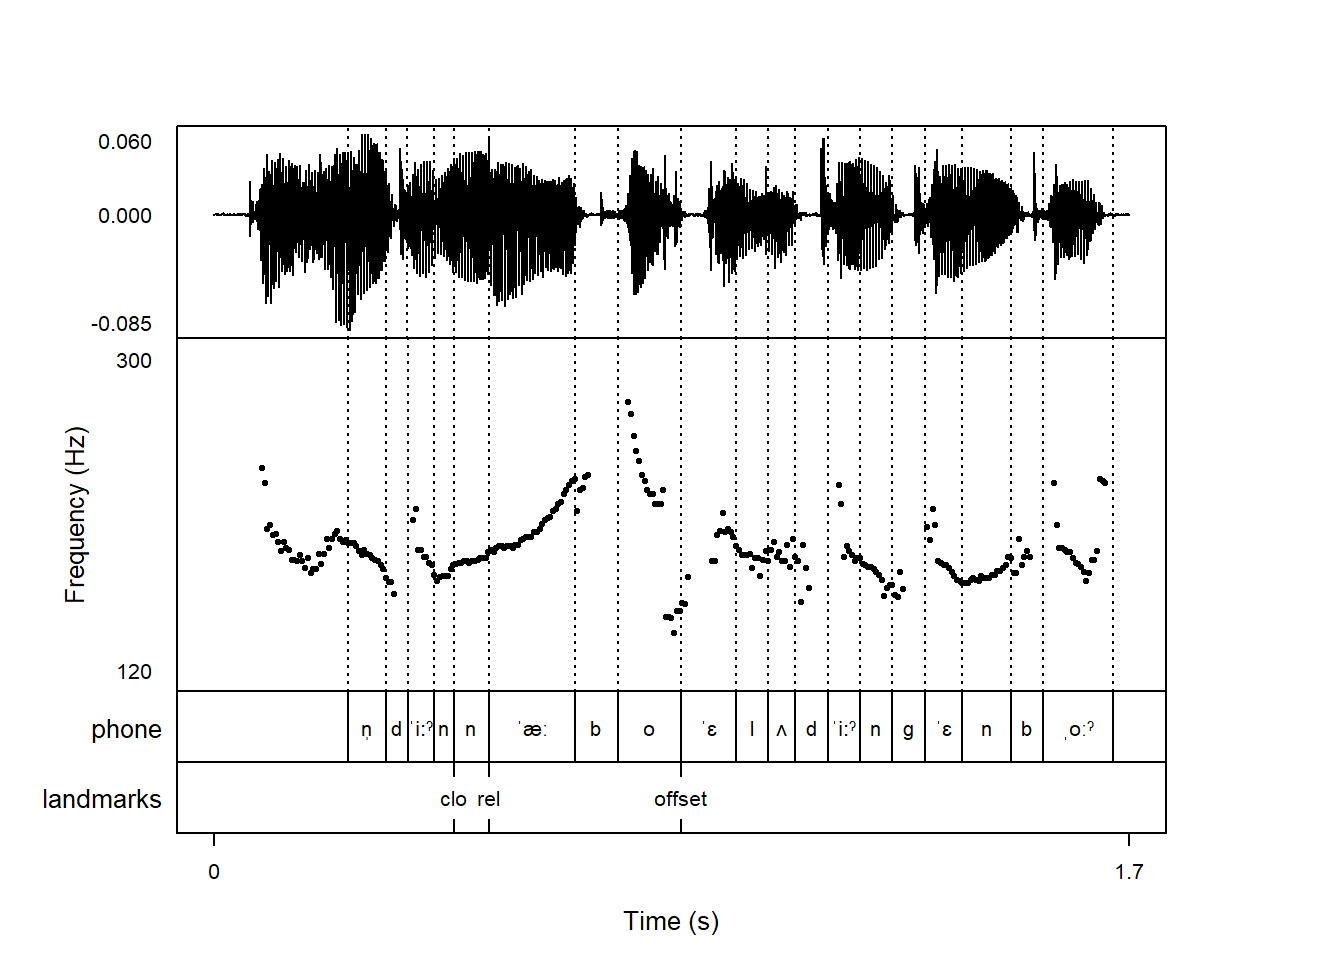
If you plot derived signals like pitch with emupicture(), it’ll by default be calculated on the fly, as in praatpicture():
emupicture(db_handle = db,
           session = '_044',
           bundle = '044nabo-nasal-alv-low-nst-NA-NA-NA-NA-NA',
           start = 1.4, end = 3.1,
           tg_tiers = c('phone', 'landmarks'),
           frames = c('sound', 'pitch', 'TextGrid'),
           pitch_plotType = 'speckle',
           pitch_freqRange = c(120, 300))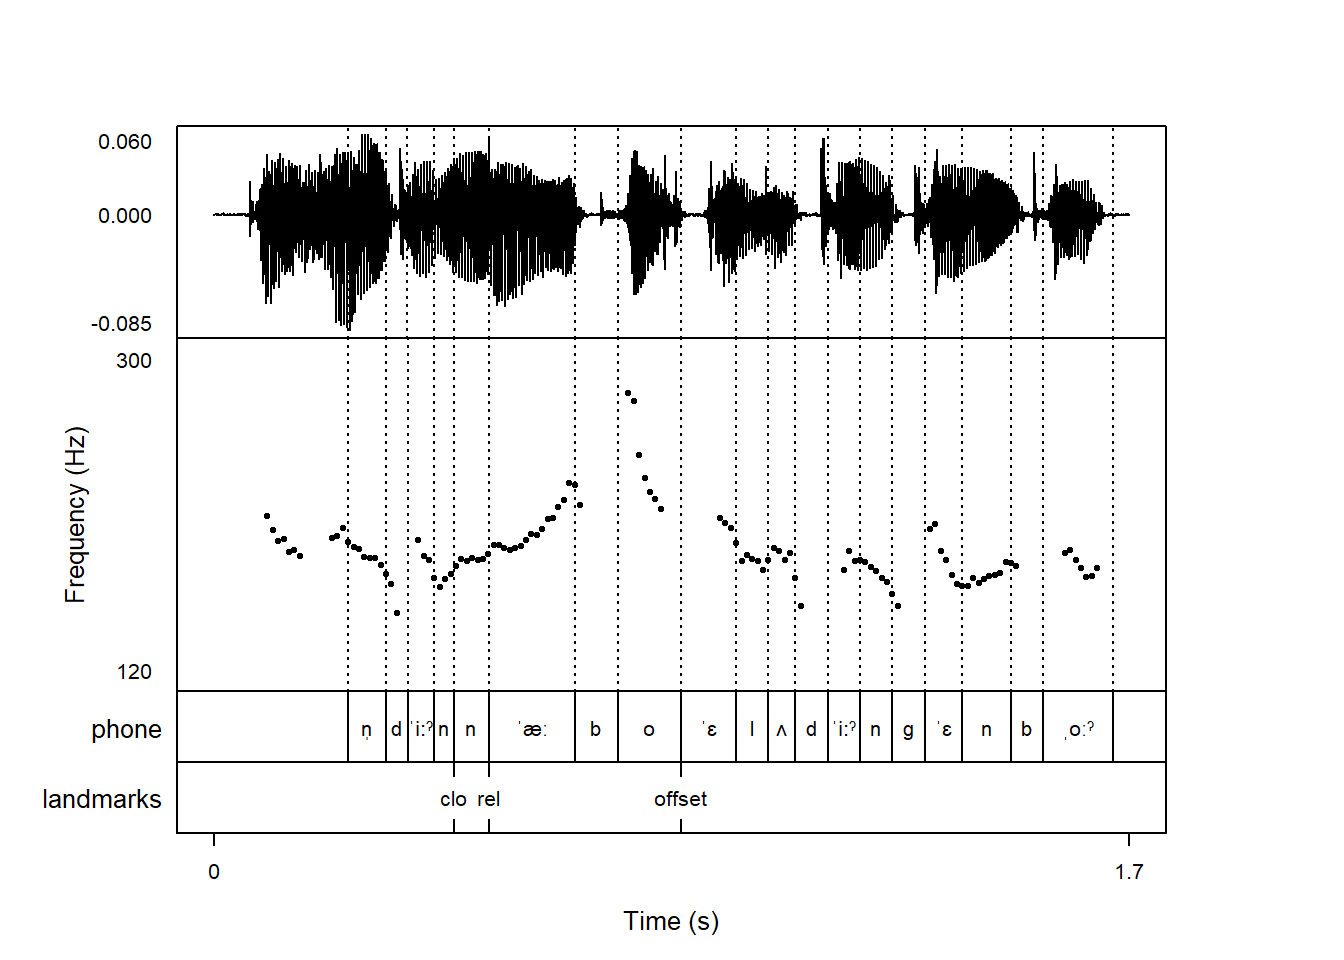
As we’ve seen previously, praatpicture() allows you to calculate these derived signals in Praat, save them, and plot those signals instead of calculating signals on the fly. If you’re an EMU user, you’re likely familiar with SSFF (simple signal file format) tracks, which is a way of associating any signal, derived or otherwise, with a database. Using emupicture(), you can choose to plot SSFF tracks instead of calculating signals on the fly.
Our toy database has two different SSFF tracks associated with it, which we can check with the list_ssffTrackDefinitions() function.
list_ssffTrackDefinitions(db)f0 is a pitch track calculated using Praat, and rf0 is a pitch track calculated using REAPER. If you want to use one of these SSFF tracks instead of calculating pitch on the fly, you can do it using the pitch_ssffExt argument. There are similar arguments for formant_ssffExt and intensity_ssffExt.
Here’s the pitch track calculated using Praat:
emupicture(db_handle = db,
           session = '_044',
           bundle = '044nabo-nasal-alv-low-nst-NA-NA-NA-NA-NA',
           start = 1.4, end = 3.1,
           tg_tiers = c('phone', 'landmarks'),
           frames = c('sound', 'pitch', 'TextGrid'),
           pitch_plotType = 'speckle',
           pitch_freqRange = c(120, 300),
           pitch_ssffExt = 'f0')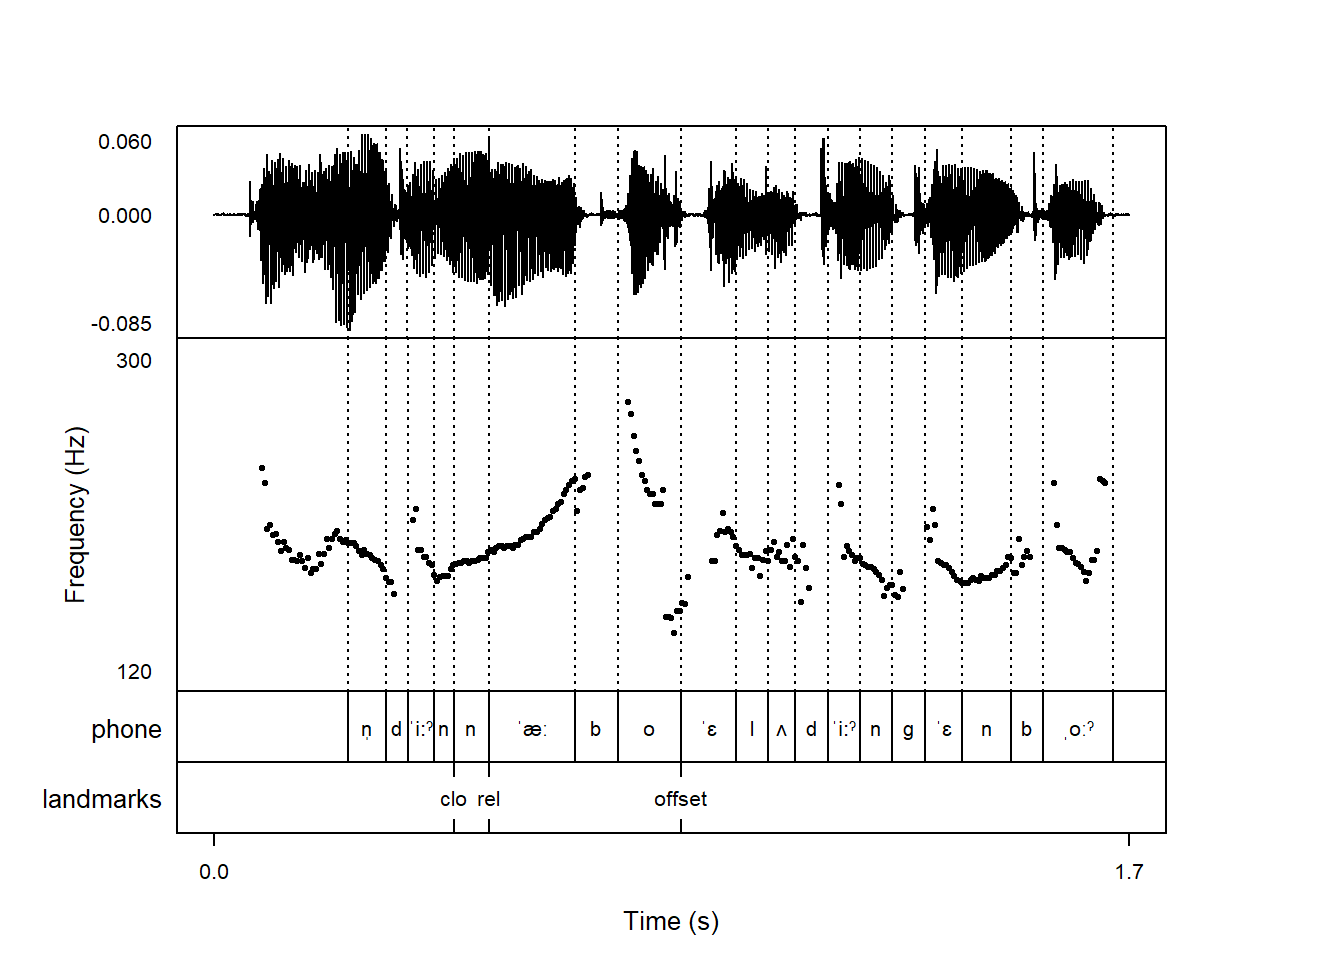
And here’s the pitch track calculated using REAPER:
emupicture(db_handle = db,
           session = '_044',
           bundle = '044nabo-nasal-alv-low-nst-NA-NA-NA-NA-NA',
           start = 1.4, end = 3.1,
           tg_tiers = c('phone', 'landmarks'),
           frames = c('sound', 'pitch', 'TextGrid'),
           pitch_plotType = 'speckle',
           pitch_freqRange = c(120, 300),
           pitch_ssffExt = 'rf0')