install.packages('reapeR')Working with REAPER in R
reapeR is an R package providing access to David Talkin’s Ropust Epoch and Pitch EstimatoR (REAPER) algorithm. REAPER is a C++ library that provides precise pitch tracking and epoch estimation from speech data. reapeR provides access to relevant parts of the algorithm, with functions for running the pitch and epoch estimation algorithm (in bulk or on a single sound file), and for converting REAPER output into files that can be used with Praat and EMU.
If you run into any problems with the package, I’m happy to hear about them.
Installation
reapeR is available on CRAN and can be installed in the usual way:
Running REAPER from R
You can now track pitch and estimate epochs using the reaper() function. In the simplest use case, you just pass a single argument with the name of a sound file.
library(reapeR)
reaper_out <- reaper('inst/extdata/1.wav')
The resulting object, reaper_out, is a list containing two elements called pitch and epochs.
class(reaper_out)[1] "list"names(reaper_out)[1] "pitch" "epochs"pitch is a tibble with columns including information about the time of each analysis frame, a column with information about whether the frame is voiced, a column with the predicted F0, and a column with the file name.
head(reaper_out$pitch) time voiced f0 file
1 0.005 0 NA inst/extdata/1.wav
2 0.010 0 NA inst/extdata/1.wav
3 0.015 0 NA inst/extdata/1.wav
4 0.020 0 NA inst/extdata/1.wav
5 0.025 0 NA inst/extdata/1.wav
6 0.030 0 NA inst/extdata/1.wavThe predicted pitch track looks like this (zooming into the middle of the file where there is voicing):
plot(reaper_out$pitch$time, reaper_out$pitch$f0, type = 'l',
     xlab = 'Time (s)', ylab = 'F0 (Hz)',
     xlim = c(0.5, 1))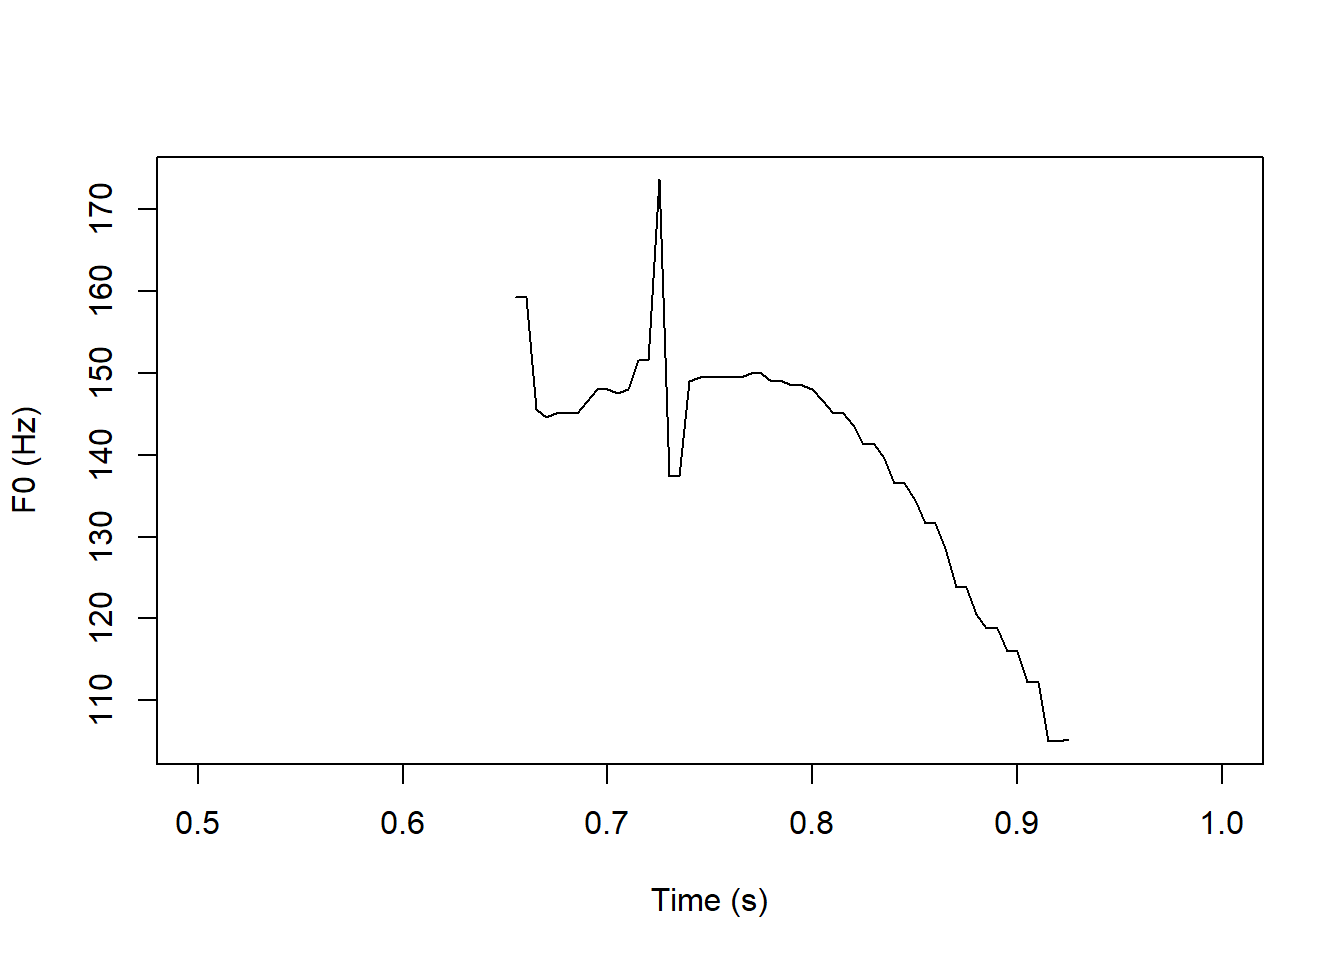
epochs is just a named vector of values telling you the locations of glottal closure instants:
reaper_out$epochs$`inst/extdata/1.wav`
[1] 0.6515419 0.6579138 0.6646485 0.6714966 0.6783447 0.6852154 0.6920408
[8] 0.6988435 0.7056463 0.7123809 0.7195011 0.7258730 0.7332426 0.7400454
[15] 0.7468254 0.7535601 0.7602494 0.7669161 0.7736055 0.7803175 0.7870975
[22] 0.7937868 0.8005896 0.8074149 0.8143311 0.8212925 0.8283900 0.8355102
[29] 0.8428345 0.8502721 0.8578911 0.8656462 0.8738095 0.8820862 0.8905669
[36] 0.8992290 0.9082086 0.9176871Here they are plotted along with the sound file in question:
snd <- tuneR::readWave('inst/extdata/1.wav')
times <- seq(0, length(snd@left) / snd@samp.rate,
             length.out = length(snd@left))
plot(times, snd@left, type = 'l', xlab = 'Time (s)', ylab = '', yaxt = 'n',
     xlim = c(0.65, 0.95))
abline(v = reaper_out$epochs[[1]], col='lightgrey')
box()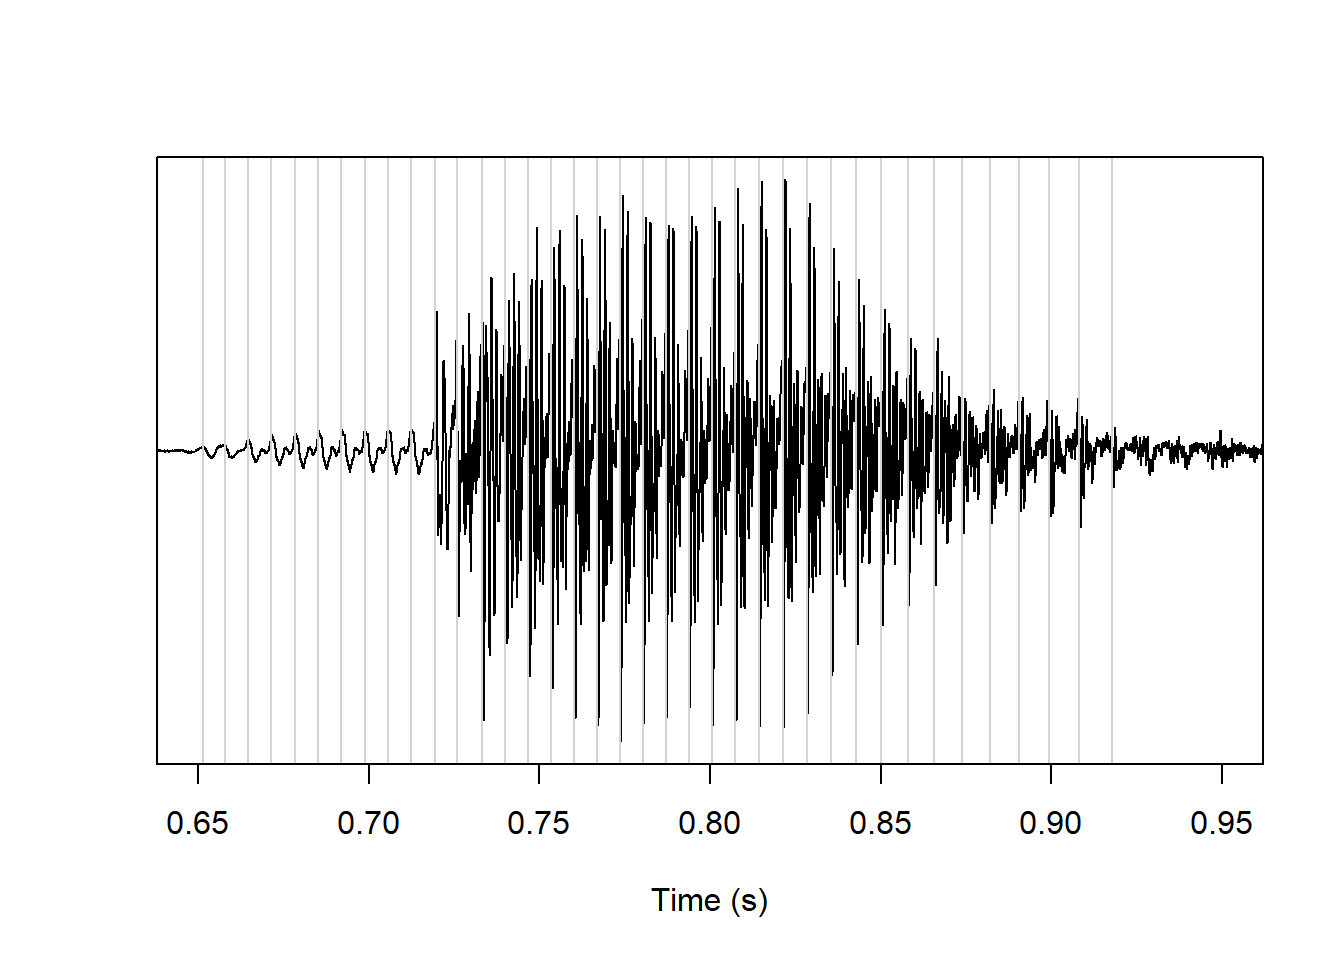
If you want just a data frame with pitch values, or just a vector of glottal closure instants, this can be controlled with the output argument. You also have access to a number of other potentially useful values estimated by REAPER. For example, the output gci_cand gives you access to the normalized cross-correlation at each candidate glottal closure instant, which could be one useful measure of voicing probability:
gci_cand <- reaper('inst/extdata/1.wav', output = 'gci_cand')

graphics::par(mar = c(0,2,0,2), mfrow = c(2,1),
              oma = c(5,4,3,4))

plot(times, snd@left, type = 'l', xlab = 'Time (s)', ylab = '', yaxt = 'n', xaxt = 'n')
plot(gci_cand$time, gci_cand$nccf, type = 'l')
mtext('CCF (norm.)', side=2, line=3.5, cex=0.8)
mtext('Time (s)', side=1, line=3, outer=T, cex=0.8)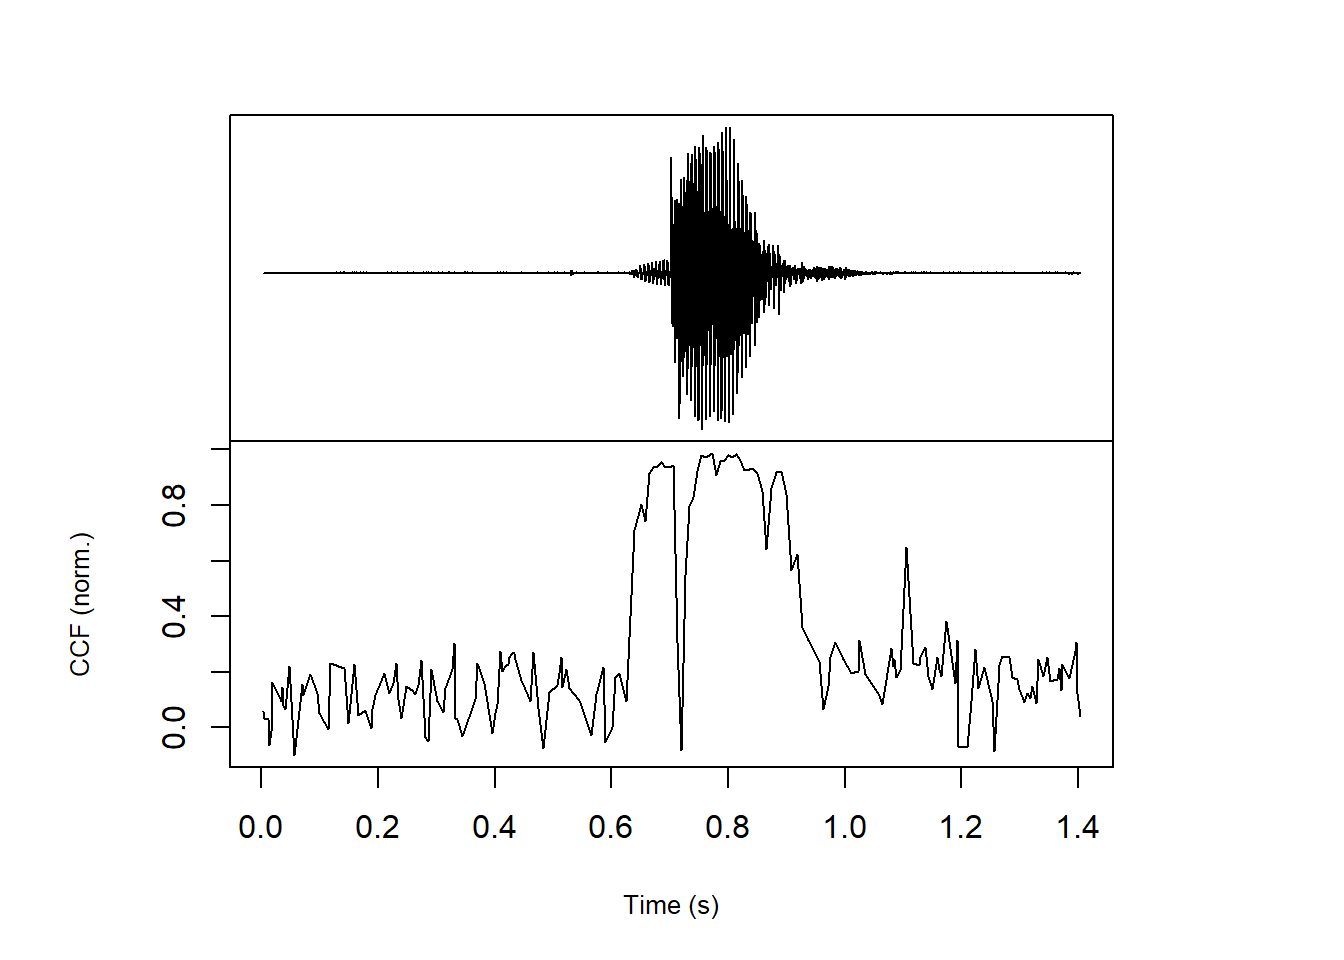
The output probs gives a number of other measures related to voicing probability.
probs <- reaper('inst/extdata/1.wav', output = 'probs')This includes frame-wise probabilities of voicing onset an voicing offset:
graphics::par(mar = c(0,2,0,2), mfrow = c(2,1),
              oma = c(5,4,3,4))

plot(times, snd@left, type = 'l', xlab = 'Time (s)', ylab = '', yaxt = 'n', xaxt = 'n', xlim = c(0.55, 1.1))
plot(probs$time, probs$voice_onset_prob, type = 'l',
     xlim = c(0.55, 1.1))
mtext('Probability of voicing onset', side=2, line=3.5, cex=0.8)
mtext('Time (s)', side=1, line=3, outer=T, cex=0.8)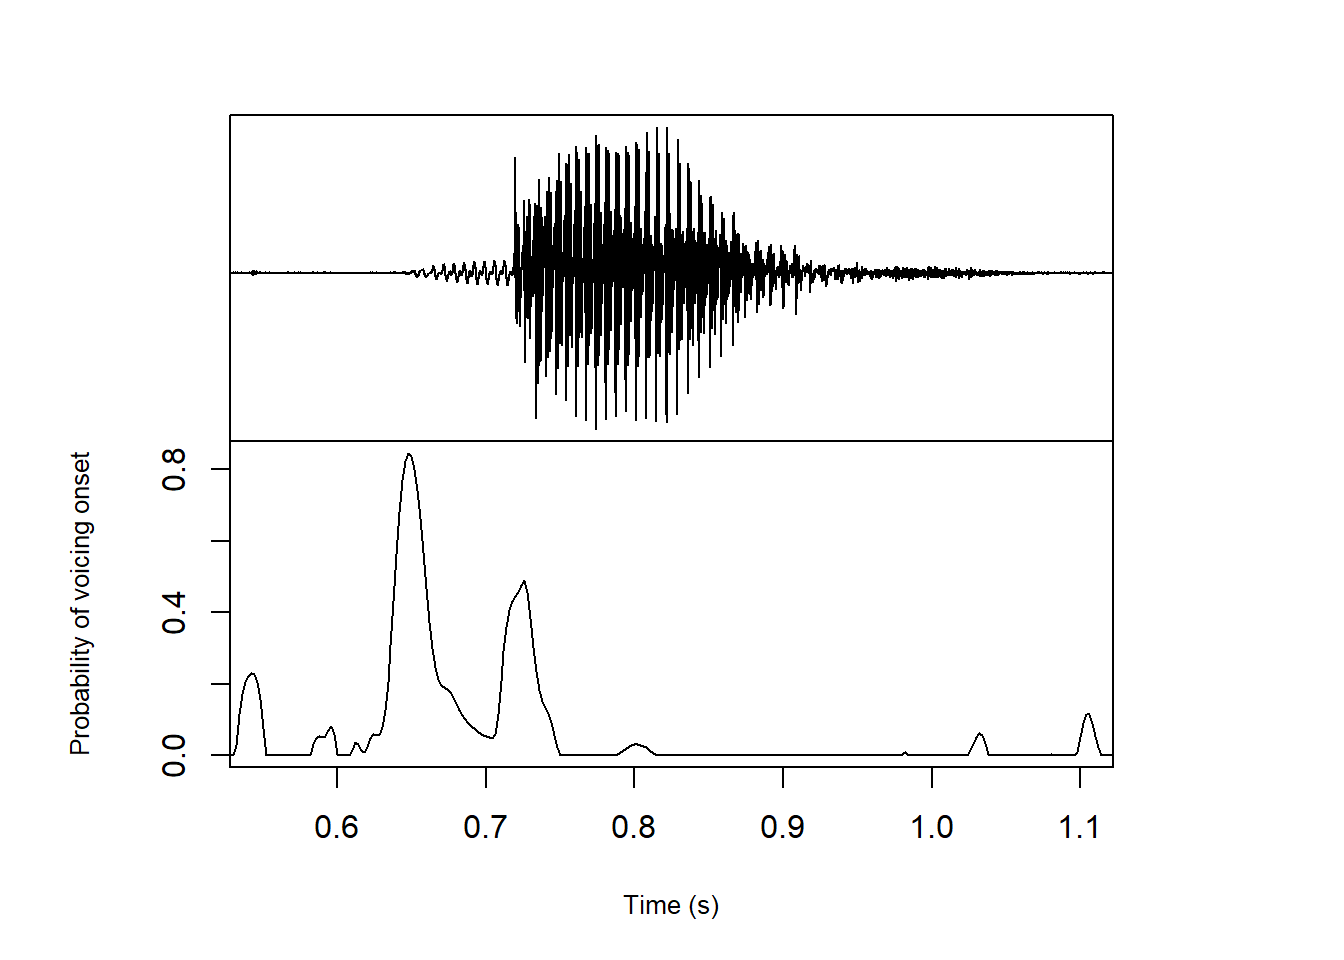
graphics::par(mar = c(0,2,0,2), mfrow = c(2,1),
              oma = c(5,4,3,4))

plot(times, snd@left, type = 'l', xlab = 'Time (s)', ylab = '', yaxt = 'n', xaxt = 'n', xlim = c(0.55, 1.1))
plot(probs$time, probs$voice_offset_prob, type = 'l',
     xlim = c(0.55, 1.1))
mtext('Probability of voicing offset', side=2, line=3.5, cex=0.8)
mtext('Time (s)', side=1, line=3, outer=T, cex=0.8)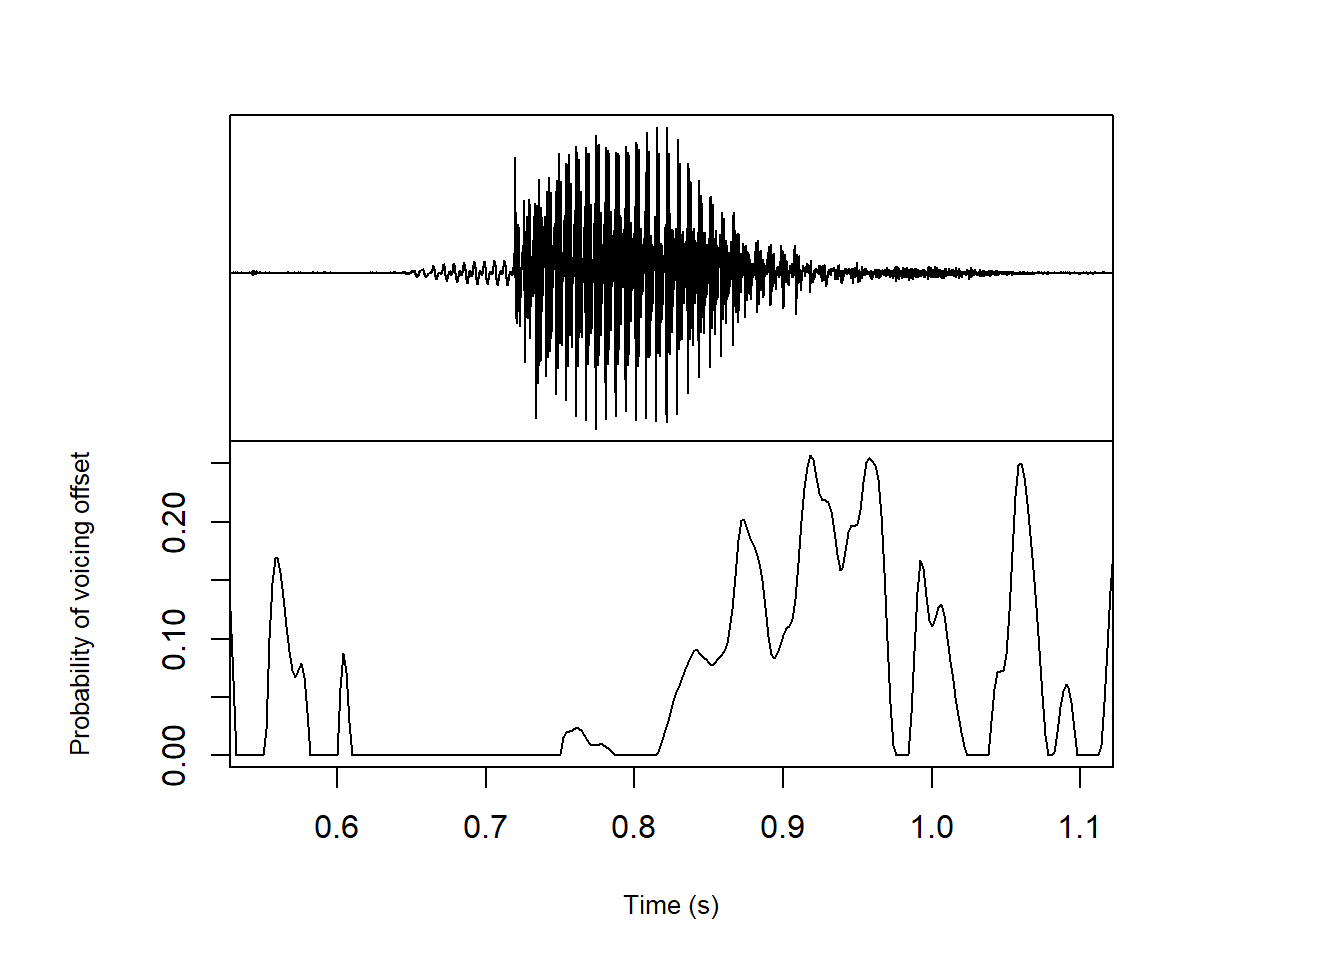
This output also includes REAPER’s “pseudo-probability of voicing” measure, which corresponds to normalized bandpassed RMS amplitude:
graphics::par(mar = c(0,2,0,2), mfrow = c(2,1),
              oma = c(5,4,3,4))

plot(times, snd@left, type = 'l', xlab = 'Time (s)', ylab = '', yaxt = 'n', xaxt = 'n')
plot(probs$time, probs$prob_voiced, type = 'l')
mtext('Pseudo-probability of voicing', side=2, line=3.5, cex=0.8)
mtext('Time (s)', side=1, line=3, outer=T, cex=0.8)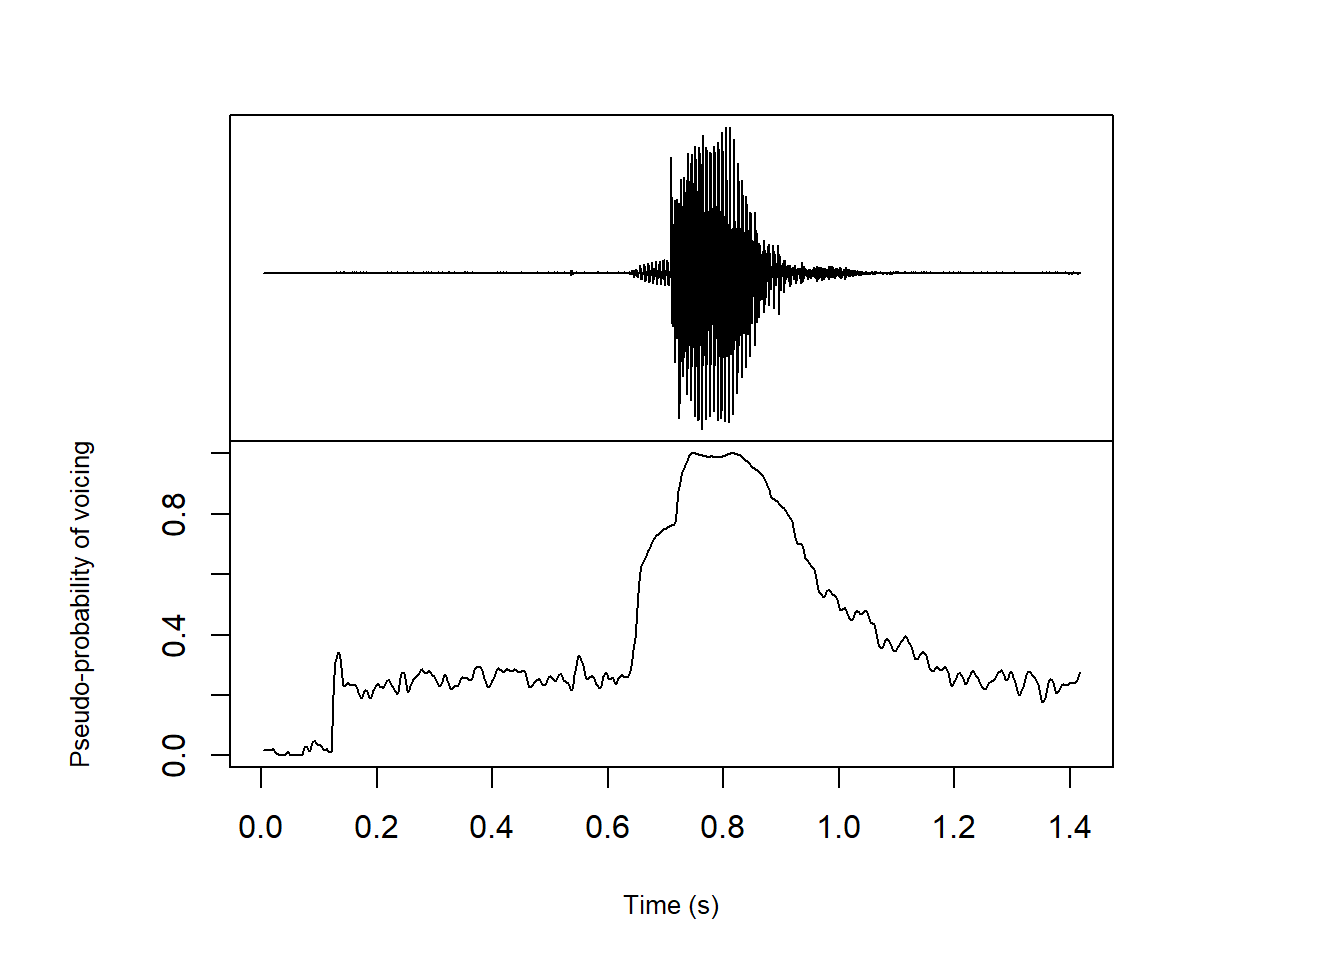
For debugging, you can also get the resids output, containing things like filtering residuals.
reaper() accepts arguments like start and end times, channel to be used for analysis, pitch floor and ceiling, analysis interval etc. These arguments can be inspected by calling ?reaper from the console.
If you want to run REAPER on all files in a directory, you can do so with the reaper_bulk() function, where you pass the path to a directory instead of the path to a sound file:
reaper_output <- reaper_bulk('inst/extdata')reaper_bulk() has a few more interesting options.
There’s the argument hirst2pass, which can be set to TRUE to use the Hirst/De Looze two-pass procedure to estimate suitable pitch floor and ceiling values. In this case, REAPER is run with very liberal floor and ceiling values on the directory, and the resulting pitch is used to estimate more suitable values for a second pass.
Additionally, the praat_output argument can be set to TRUE, in which case the REAPER estimated pitch is also saved as .Pitch files that can be read in Praat (to a directory specified with praat_output_dir).
Working with REAPER output
If you already have REAPER files lying around, the library also comes with several functions to work with REAPER output files.
read_pitch_out() will read an ASCII-formatted REAPER pitch output file (saved with -f filename -a) as a well-formatted tibble.
pitchOut <- read_pitch_out('inst/extdata/pitch')
head(pitchOut)
# A tibble: 6 × 3
time voiced f0
<dbl> <dbl> <dbl>
1 0.005 0 NA
2 0.01 0 NA
3 0.015 0 NA
4 0.02 0 NA
5 0.025 0 NA
6 0.03 0 NAread_epochs_out() will read an ASCII-formatted REAPER epochs (‘pitchmarks’) output file (saved with -p filename -a) as a vector.
epochsOut <- read_epochs_out('inst/extdata/epochs')
epochsOut
[1] 0.651542 0.657914 0.664649 0.671497 0.678345 0.685215 0.692041 0.698844
[9] 0.705646 0.712381 0.719501 0.725873 0.733243 0.740045 0.746825 0.753560
[17] 0.760249 0.766916 0.773605 0.780317 0.787098 0.793787 0.800590 0.807415
[25] 0.814331 0.821293 0.828390 0.835510 0.842834 0.850272 0.857891 0.865646
[33] 0.873810 0.882086 0.890567 0.899229 0.908209 0.917687Working with output in Praat
If you’re interested in working with this output in Praat, the write_praat_pitch() function will save a tibble with pitch output as a .Pitch file, and the write_praat_epochs() function will save a vector with epoch output as a .PointProcess file.
Working with output in EMU
If you want to import REAPER-estimated pitch into an EMU database, you can import a tibble with pitch output to a database using the reaper2emuDB() function.